 Improving air quality is good for both the planet's health and the people living there. Air pollution is a serious issue contributing to health problems across the world. Understanding the atmosphere's composition – including greenhouse gasses – is essential to combat pollution and global warming.
One of the major sources of pollution is ozone (O3). Ozone is synthesised as burning vegetation, and fossil fuels emit carbon-based volatile organic compounds (VOCs) and nitrogen oxides (NOX) which undergo chemical reactions as they interact with sunlight in the atmosphere. UV radiation also breaks down oxygen into individual oxygen atoms, which then recombine with other oxygen molecules to form ozone.
There is a dual nature to ozone. At ground level, it contributes to photochemical smog, negatively affecting air quality, and harming health. Once ozone reaches the upper atmosphere it helps cool the Earth by reflecting or absorbing some of the Sun’s radiation. The anthropomorphic creation of ozone has caused concentrations to rise 30% since the pre-industrial era and it is now considered the 3rd most significant greenhouse gas, behind carbon dioxide and methane.
Satellites are the best way to gather data about the whole Earth, but they also present a challenge. Observations of the lowest level of the atmosphere – the troposphere – can be obscured by layers of clouds and muddled by the ozone layer found in the stratosphere. The lower atmosphere tends to experience much more spatial and temporal variability making the detection of trace gases more difficult.
Those difficulties meant that the pollutant emission inventories required for predicting air quality were uncertain by up to 50%. With an increased understanding of how pollutants are transported through the atmosphere, researchers would be better equipped to issue air quality warnings to protect people.
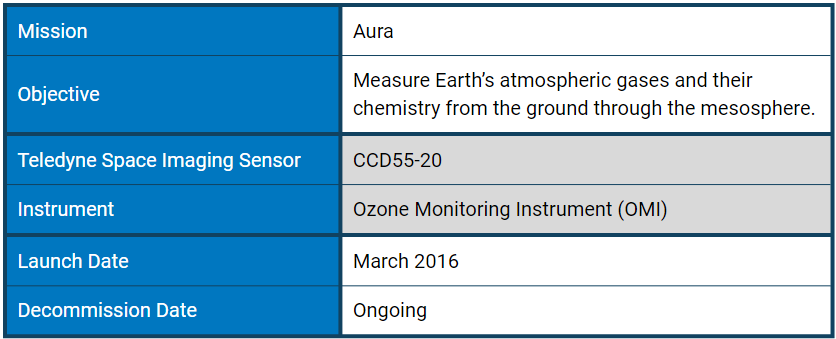
Launched in July of 2004, NASA’s Aura satellite joined the A-Train – a series of Earth observation satellites dedicated to understanding the Earth as a complex system. Aura’s mission is to study trace gas pollutants in the troposphere and create accurate and detailed global emissions maps and climate models.
As a member of the A-Train, Aura – latin for ‘breeze’ – is designed to synergise data collection with other satellites. It can produce highly consistent data with the OMPS UV spectrometer on NASA’s and NOAA’s JPSS/NOAA-20, Sumoi NPP and the TROPOMI UV spectrometer on ESA’s Sentinel 5P – all of which contain sensors from Teledyne Space imaging.
The sensitive instruments on Aura can identify five of the six “criteria pollutants” designated by the U.S. Environmental Protection Agency (EPA): carbon monoxide, nitrogen dioxide, sulfur dioxide, ozone, particulates (aerosols), and lead (which Aura isn’t equipped to detect). Observations from limb sounding and nadir imaging allow studies of the horizontal and vertical distribution of atmospheric pollutants and greenhouse gases and how the composition evolves and changes with time.
Ozone Monitoring Instrument (OMI)
OMI is a nadir viewing spectrometer that measures solar reflected and backscattered light.
Developed by the Netherlands Agency for Aerospace Programs (NIVR) and the Finnish Meteorological Institute (FMI), OMI is the first UV-Visible Earth remote-sensing instrument to employ a two-dimensional CCD array for simultaneous spatial and spectral registration. The Teledyne Space Imaging CCD55-20 push-broom detector arrays are back-illuminated and feature frame-transfer operation for simultaneous exposure and readout of the previous exposure.
The instrument has a FOV of 114º and can observe a swath of 2600 km with a small ground pixel size (13x24 km2 at nadir). Additionally, the viewing swath is perpendicular to the orbit track, providing complete daily coverage of the sunlit portion of the atmosphere. It has two channels in the spectral range of 270-500 nm to distinguish aerosols, such as smoke, dust, and sulphates, and measure cloud pressure and coverage.
OMI measurements of ozone and cloud cover are used by scientists to determine the amount of ultraviolet radiation (UV) reaching the Earth’s surface. The National Weather Service then uses that data to forecast high UV index days for public health awareness.
Using high-resolution global maps of air quality indicators made with Aura data, scientists tracked air pollution trends between 2005 and 2015 in various regions and 195 cities around the globe.
The United States and Europe are among the largest emitters of nitrogen dioxide. Fortunately, Aura collected evidence validating environmental regulations implemented to curb emissions. Nitrogen dioxide had decreased from 20 to 50 percent in the United States, and by as much as 50 percent in Western Europe.
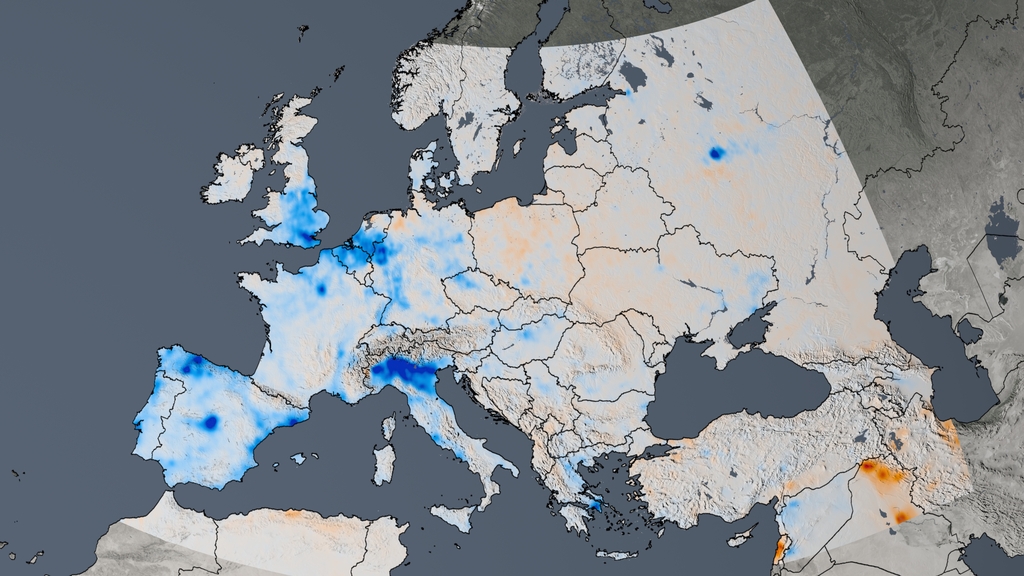 This trend map of Europe shows the change in nitrogen dioxide concentrations from 2005 to 2014. Credit NASA's Goddard Space Flight Center
In the early 2000s, China began implementing policies to reduce emissions. Data from Aura’s OMI validated those programs with a 75% drop in sulfur dioxide emissions. This decrease occurred despite an increase in coal usage by about 50% and electricity generation by 100%. However, those increases would explain the growth of NO2 emissions, which increased by 20 to 50%, much of it over the North China Plain: the world’s growing manufacturing hub. Three major Chinese metropolitan areas — Beijing, Shanghai, and the Pearl River Delta — demonstrated up to a 40% reduction.
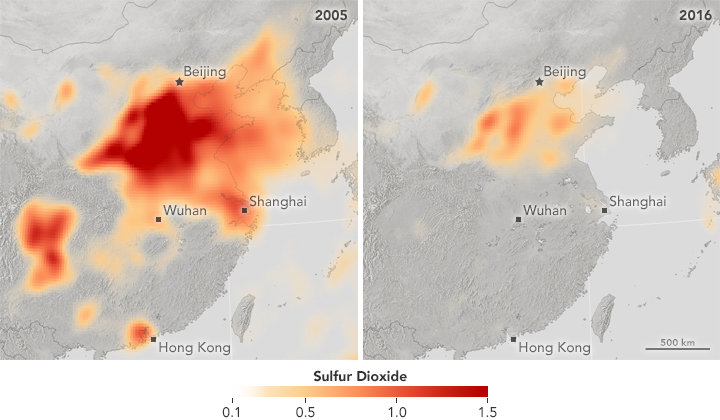 Changes in SO2 observations over China between 2005 and 2016 with OMI on Aura of NASA, expressed in Dobson Units (1 DU = 2.69 x 10¹⁶ molecules cm-2). The values are yearly averages of SO2 concentrations Credit: NASA Earth Observatory, images by Jesse Allen, using OMI data courtesy of Chris McLinden (Environment Canada)
The Johannesburg-Pretoria metro area saw decreases after new cars were required in 2008 to have better emissions controls. The heavily industrialized area just east of the cities, however, shows both decreases and increases. The decreases may be associated with fewer emissions from eight large power plants east of the cities since the decrease occurs over their locations. However, emissions increases occur from various other mining and industrial activities to the south and further east.
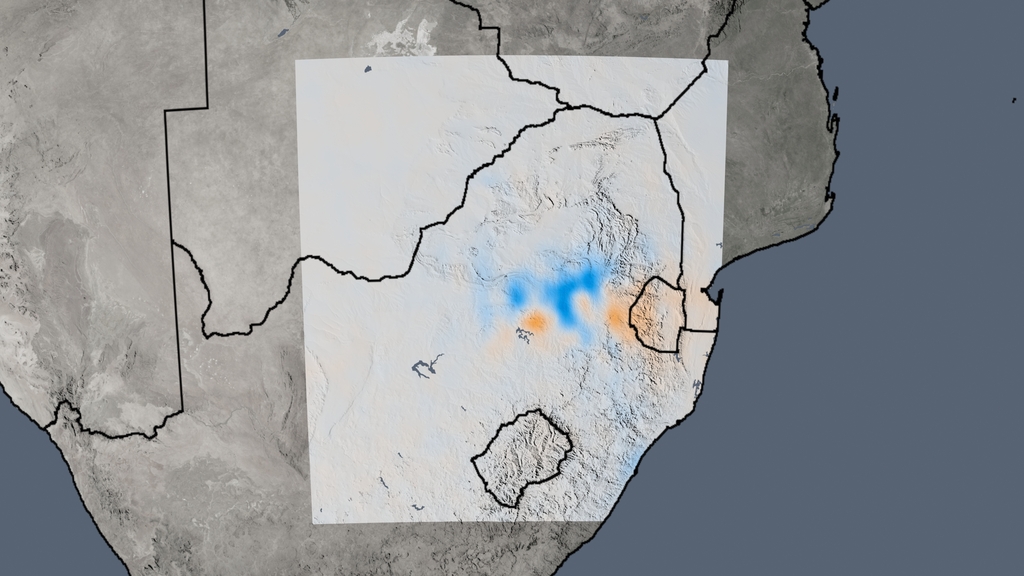 This trend map of South Africa shows the change in nitrogen dioxide concentrations from 2005 to 2014. Credit: NASA's Goddard Space Flight Center
 As Aura scanned the whole globe, it wasn’t just cities that left evidence of pollution. This map shows NO2 concentrations. The darker lines are “ship tracks” caused by ship emissions. Scientists used OMI data to detect the almost invisible tracks of nitrogen dioxide along several shipping routes from 2005 to 2012. Credit: NASA's Goddard Space Flight Center
First Direct Proof of Ozone Hole Recovery Due to Chemicals Ban
The maps show the Antarctic ozone hole on September 16 in 2006 and 2011, the two years with the lowest ozone concentrations ever measured. They were made with data from the Ozone Monitoring Instrument on Aura. Credit: NASA's Earth Observatory
Designed to detect ozone, Aura is a major source of data on the health of the ozone layer. Stratospheric ozone absorbs potentially harmful ultraviolet radiation that can cause skin cancer and cataracts, suppress immune systems and damage plant life.
Aura made direct observations of the ozone hole and confirmed that levels of ozone-destroying chlorine are declining, resulting in less ozone depletion. Measurements show that the decline in chlorine, resulting from an international ban on chlorine-containing manmade chemicals called chlorofluorocarbons (CFCs), has resulted in about 20 percent less ozone depletion during the Antarctic winter than there was in 2005 — the first year that measurements of chlorine and ozone during the Antarctic winter were made by NASA’s Aura satellite.
First Global Maps of Volcanic Emissions
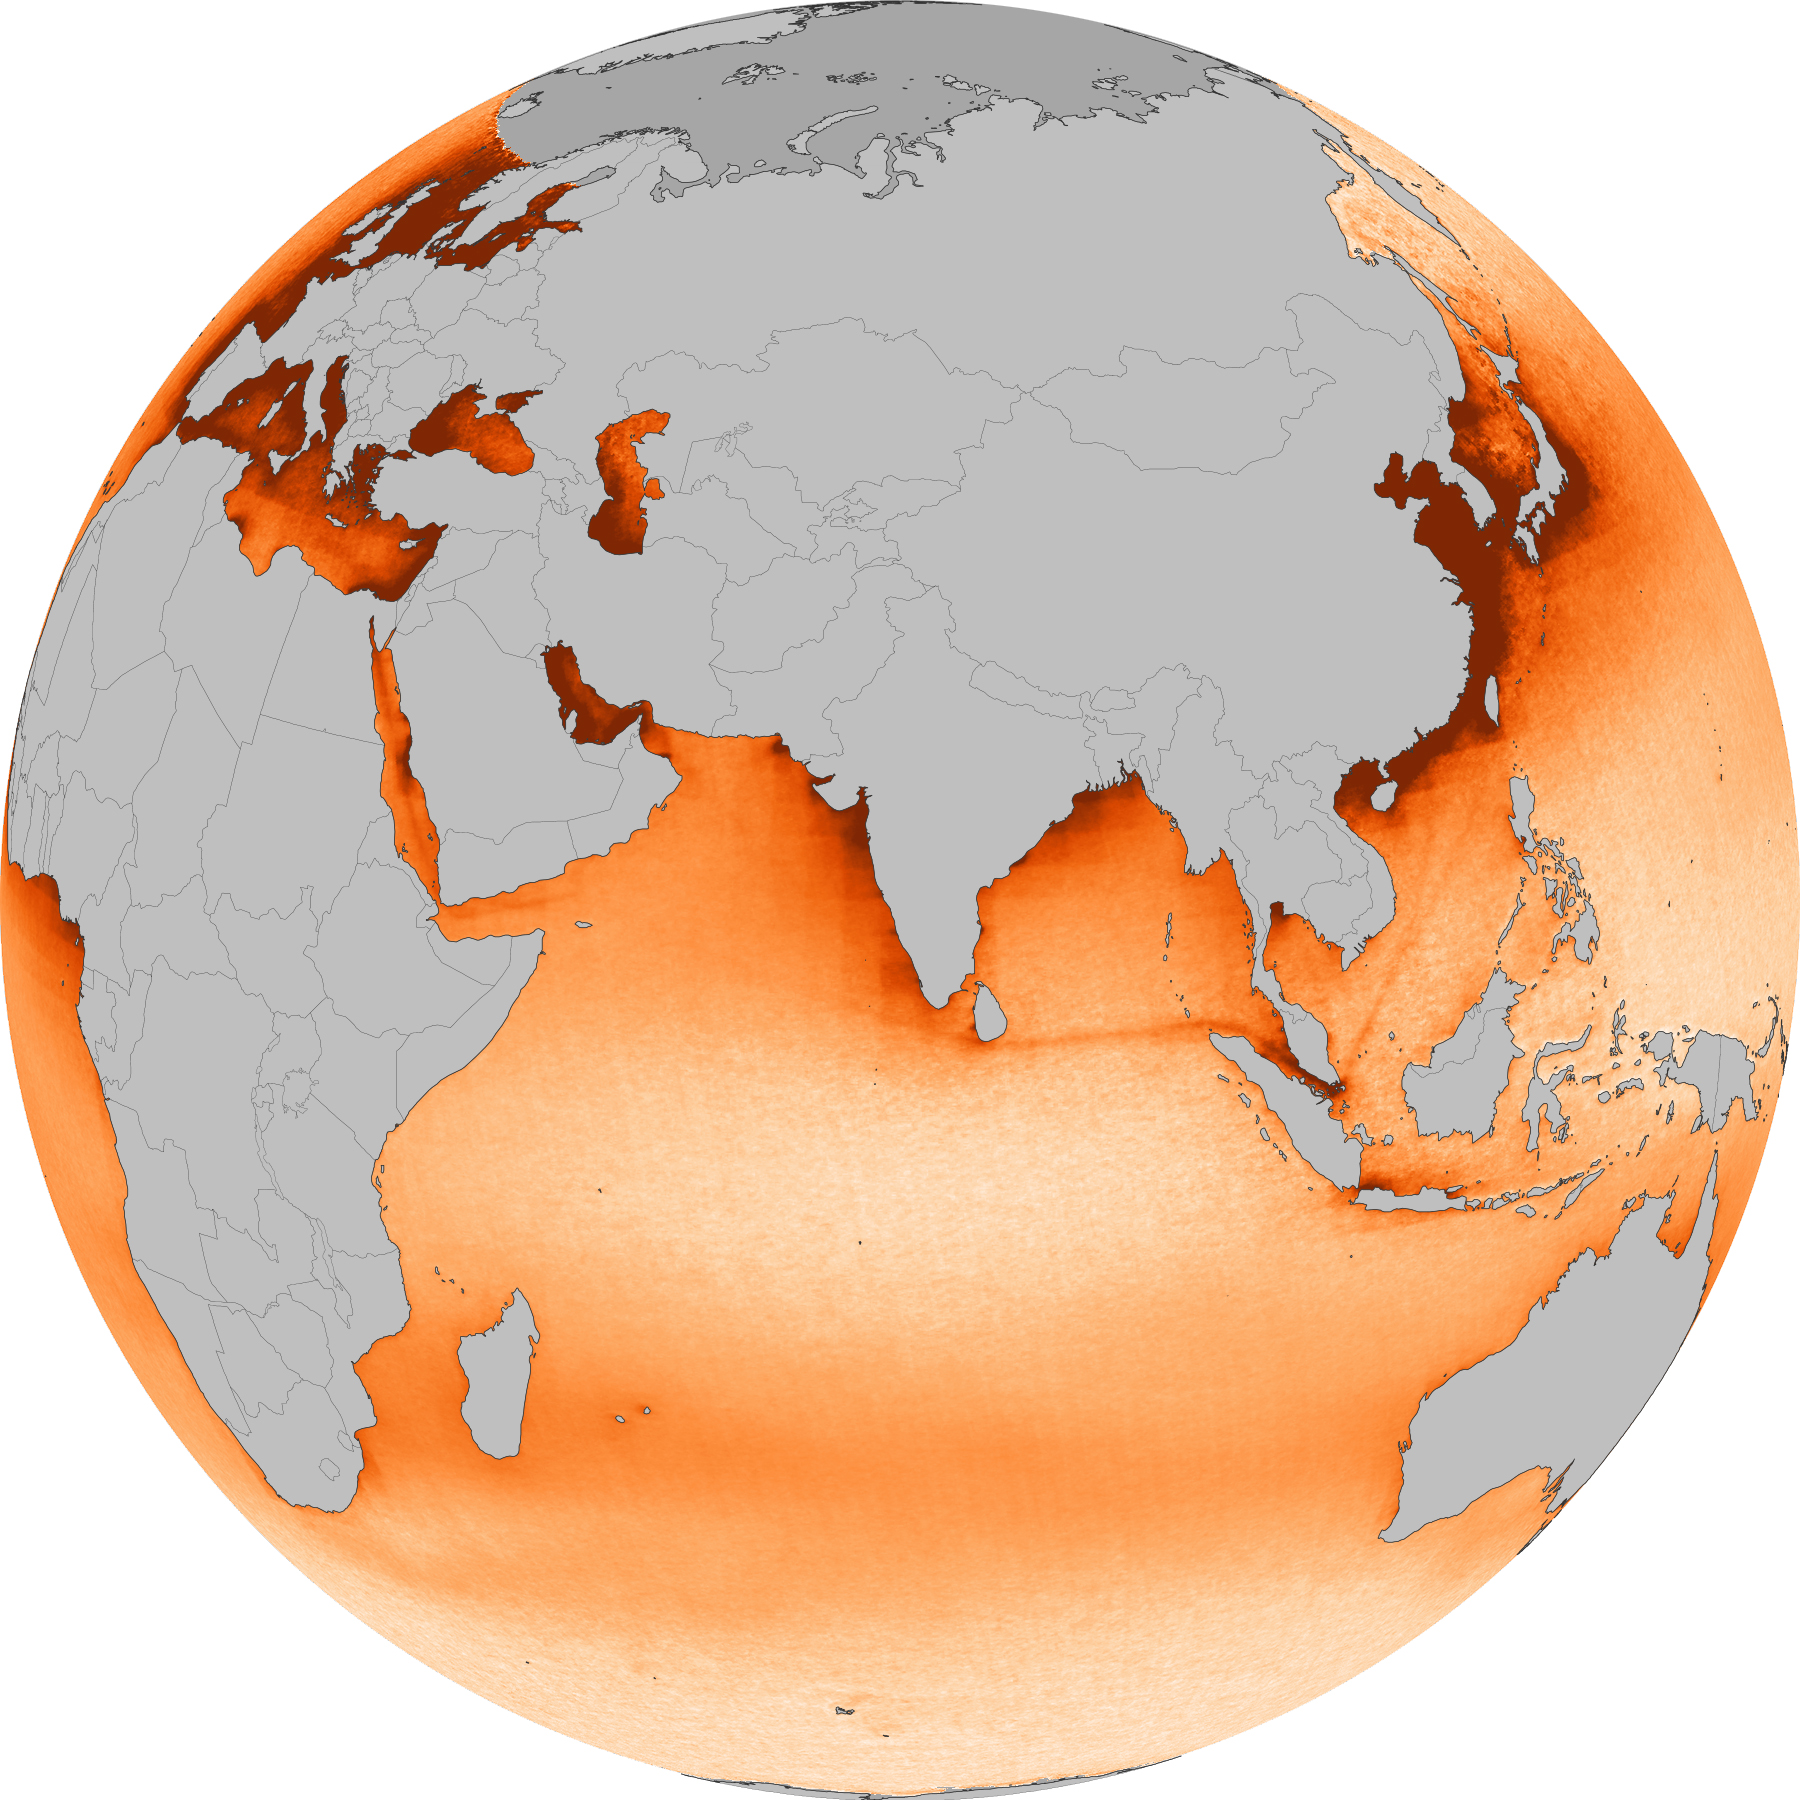
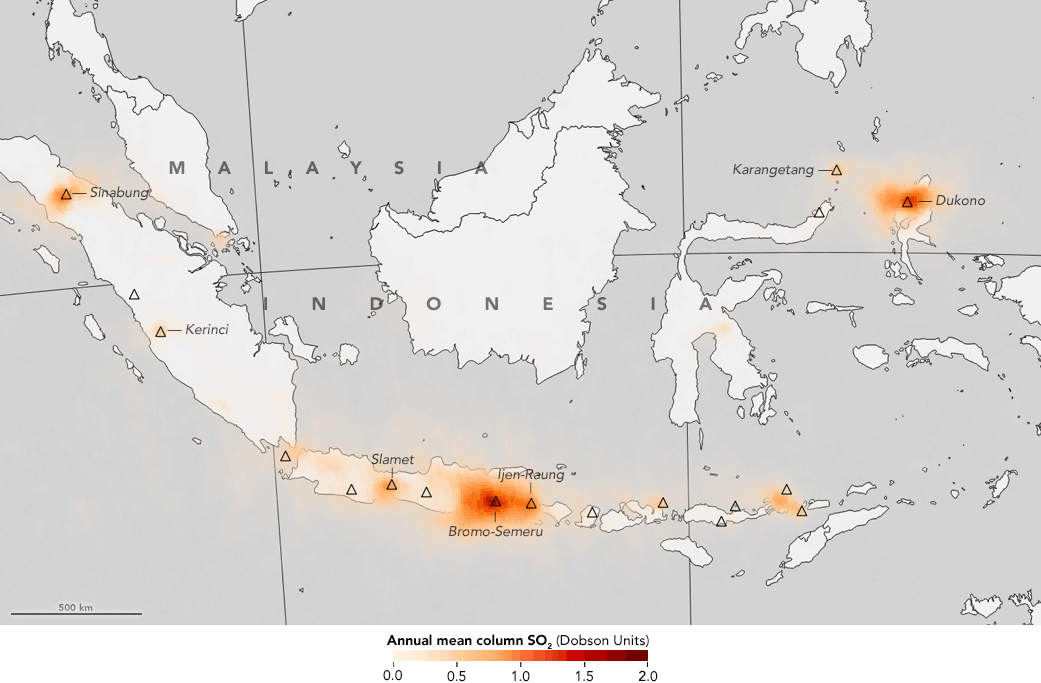 Volcanic sulfur dioxide emissions from Indonesia’s many volcanoes are shown in shades of orange. Credit: NASA’s Earth Observatory / Jesse Allen
With OMI data, researchers compiled emission concentrations from 2005 to 2015 create the first global inventory for volcanic sulfur dioxide emissions. The data set helped refine climate and atmospheric chemistry models and provided more insight into human and environmental health risks.
Aura observed major volcanic eruptions, tracking SO2 and aerosol clouds from Cumbre Vieja (Canary Islands) in 2021, Kilauea (Hawaii) in 2018, Holuhraun (Iceland) in 2014, and Eyjafjallajökull (Iceland) in 2010.
 This map shows the aerosol index over the North Atlantic following the eruption of Iceland’s Eyjafjallajökull Volcano in mid-April 2010. An index of less than 0.1 (palest yellow) indicates a haze-free sky, whereas a value of 5 (reddish brown) indicates very hazy conditions that would probably block out the sun.Credit NASA image created by Jesse Allen, using data provided courtesy of Colin Seftor, Aura OMI Science team.
Well over it’s six year design life, Aura is expected to end its mission around mid-2026 as the solar panels will no longer be able to generate enough power to operate the spacecraft. Aura completed the last of its drag makeup maneuvers in January 2023. With 20 years of observations building on decades of environmental data, Aura continued the important documentation of environmental data on the Earth.
This article is the 2nd of a four-part series covering Teledyne Space Imaging's contributions to the A-Train:
- CALIPSO
- OCO-2 (Orbiting Carbon Observatory)
- PARASOL Polarization & Anisotropy of Reflectances for Atmospheric Sciences coupled with Observations from a Lidar)

