The scientific consensus holds that human-generated carbon dioxide (CO2 ) – burning fossil fuels, agricultural practices, etc. – vastly outpaced that of CO2 released naturally through plant respiration, forest fires, decomposition, and other natural processes. Before the industrial age, Earth’s atmosphere naturally contained about 595 gigatons of carbon in the form of carbon dioxide. Currently, that number is 850 gigatons. However, a longstanding challenge remained in empirically differentiating anthropogenic CO2 emissions from those generated naturally.
Launched in July 2014, NASA’s OCO-2 mission was the first spacecraft to collect global measurements of the geographic distribution of atmospheric CO2 . The high spatial and temporal resolution of the Orbiting Carbon Observatory (OCO) spectroscopy instrument allowed researchers to regionally pinpoint CO2 sources and sinks and chart their seasonal variability. This information is essential to build accurate climate models to better predict the oncoming effects of climate change.
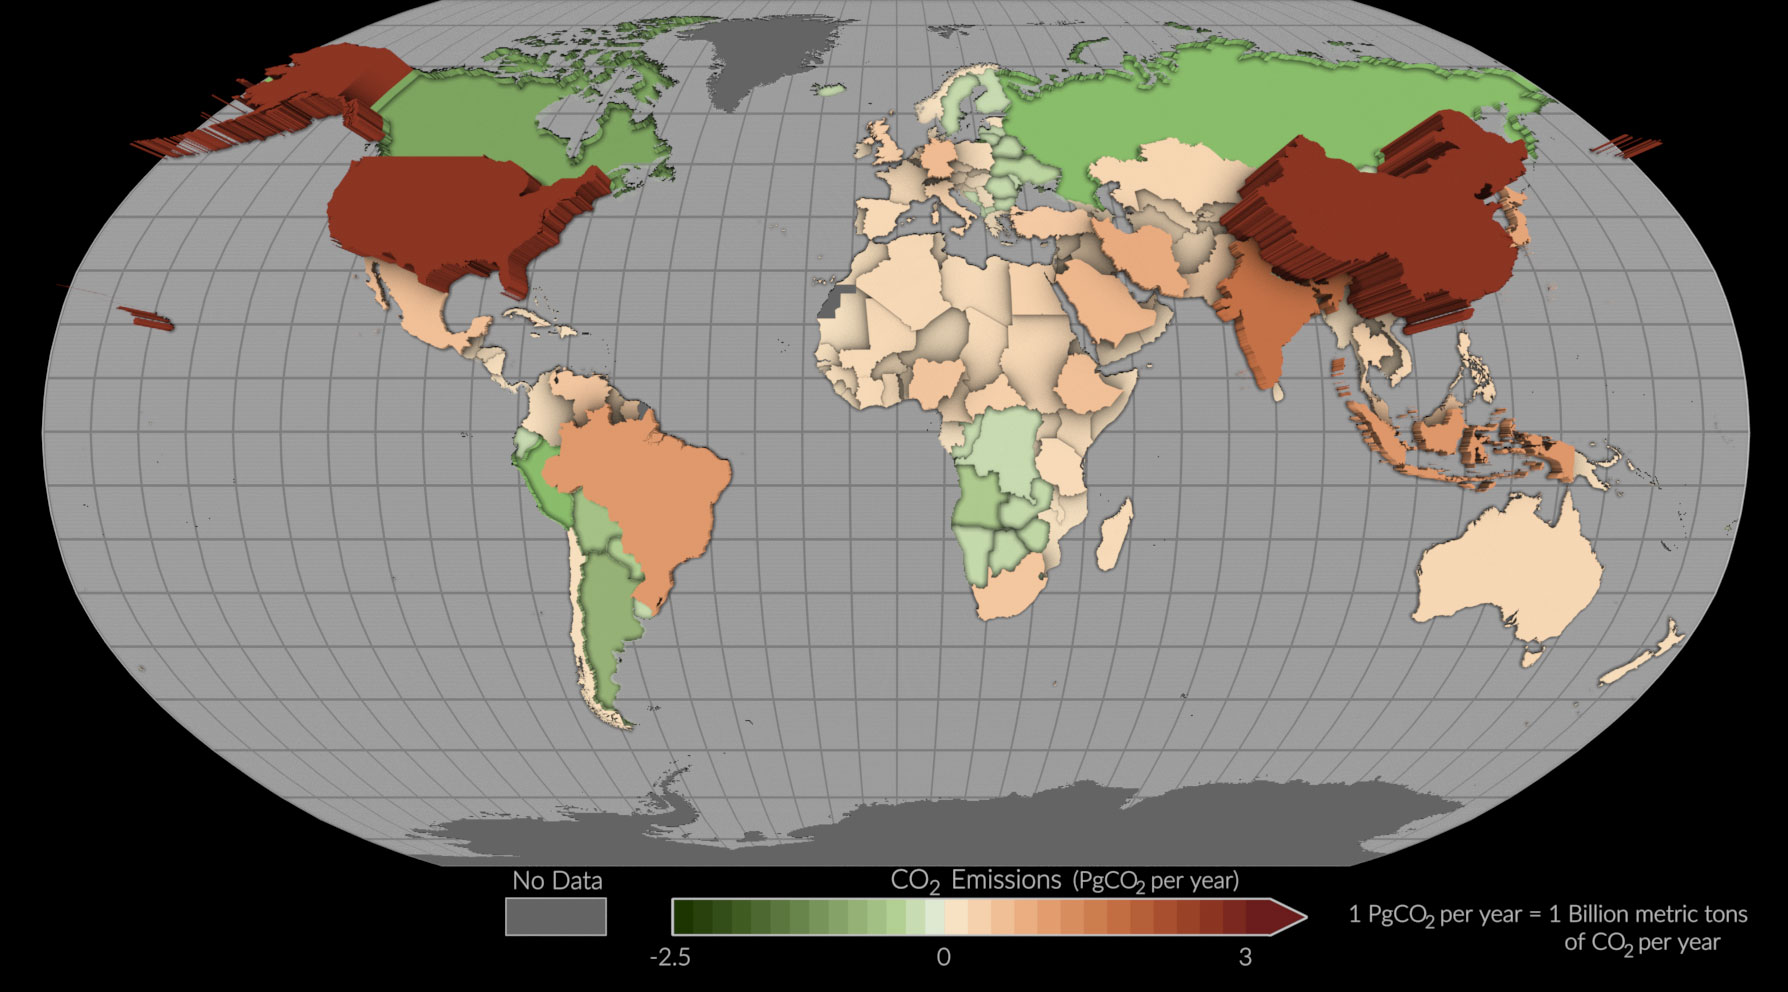 This map shows mean net emissions and removals of carbon dioxide from 2015 to 2020 using estimates informed by NASA’s OCO-2 satellite measurements. Countries, where more carbon dioxide was removed than emitted appear as green depressions, while countries with higher emissions are tan or red and appear to pop off the page. Credit: NASA’s Scientific Visualization Studio
The world’s plant life, oceans, and soils act as “carbon sinks”, steadily absorbing carbon and reducing the amount of CO2 in the atmosphere. However, the amount of carbon sequestration can vary greatly: some years removing just 20 percent of human emissions while scrubbing as much as 80 percent in other years.
As more CO2 is released, questions remain about potential changes to their effectiveness and efficiency.
Leading NASA’s A-Train constellation, OCO-2 crosses the equator at 1:30-p.m. local time. This is ideal for OCO’s spectroscopic observations since it is looking at CO2 in reflected sunlight. The afternoon sun increases reflectivity while maximising the signal-to-noise ratio, and it is around the time when CO2 generated by photosynthesis reaches a daily equilibrium. A 16-day repeat cycle documents CO2 variations in semi-monthly intervals.
An essential part of OCO-2’s technology that allows it to fly in the close A-Train formation is the SED star tracker containing a CCD47-20 from Teledyne Space Imaging. Without knowing its precise location, it would be difficult to successfully navigate.
Orbiting Carbon Observatory (OCO) Instrument
NASA’s OCO-2 spacecraft collected “first light” data on August 6 over New Guinea. OCO-2’s spectrometers recorded the bar code-like spectra, or chemical signatures of select atmospheric gasses. The dark lines indicate absorption by molecular oxygen or carbon dioxide. The backdrop is a simulation of carbon dioxide created from GEOS-5 model data. Credit: NASA/JPL-Caltech/NASA GSFC
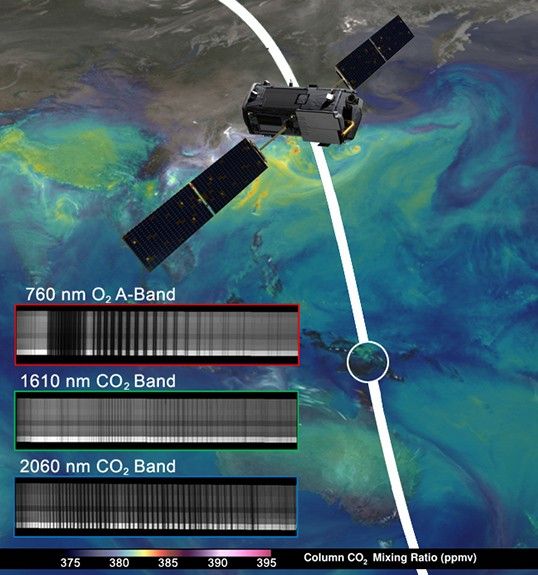
The OCO-2 spacecraft consists of a single instrument that incorporates three high-resolution and co-aligned grating spectrometers designed to measure near-infrared absorption by CO2 and molecular oxygen (O2) in reflected sunlight. Each spectrometer measures light in one specific region of the spectrum: O2 A-band at 0.76 µm, and CO2 bands at 1.61 and 2.06 µm. This requires the measurement of three relatively small bands of electromagnetic radiation, where the spectral wavelength ranges of these three critical bands are widely separated.
Each spectrometer collects a "frame" three times each second from a low Earth orbit, totalling about 9,000 frames from each orbit. Each frame is divided into eight spectra, or chemical signatures, that record the amount of molecular oxygen or carbon dioxide over adjacent ground footprints. Each footprint is about 2.25 kilometres (1.3 miles) long and a few hundred meters wide. This resolution increased cloud-free retrievals and reduced errors to a precision of 0.3% (1 ppm CO2) over a regional scale of 1000 kilometres (620 miles).
The Teledyne Space Imagaing HAWAII-1RG FPA focal plane associated with each spectrometer is designed to detect very fine differences in wavelength. OCO uses diffraction grating to spread the light spectrum into a large number of very narrow wavelength bands or colours, incorporating 17,500 different colours to cover the entire wavelength range as seen by the human eye. A camera covers the same wavelength range using just three colours.
Teledyne Space Imaging also provided the FPA for the OCO instrument on the OCO-3 flying on the ISS, as well as a twin OCO instrument on OCO-1 mission that failed at launch.
This visualisation provides a high-resolution, three-dimensional view of global atmospheric CO2 concentrations from September 1, 2014 to August 31, 2015. The dark red and orange shades represent higher concentrations. During fall and winter in the Northern Hemisphere, CO2 increases as trees and plants lose their leaves and decay. The inhibition of plant growth decreases the rate of carbon sequestration, allowing concentrations to climb until the spring and summer months. Seasonal wildfires in Africa and South America increase concentrations in the Southern Hemisphere. The visualisation was created using output from NASA’s Goddard Earth Observing System (GEOS) modelling system. The height of Earth’s atmosphere and topography have been exaggerated to show the complexity of the atmospheric flow. Credit: NASA's Scientific Visualization Studio
As countries enact policies to curb their emissions, it’s important to ensure that these solutions are having the intended effect. Using data from OCO-2, researchers tracked carbon dioxide emissions for more than 100 countries around the world, 50 of which had not reported emissions for at least the past 10 years. Tracking CO2 emissions is resource-intensive and not always accurate. Top-down imaging from space allows more countries to study their emissions and achieve their climate goals along with other nations.
Emission Reductions During COVID-19 Lockdowns
Data from OCO-2 confirmed earlier studies that calculated a drop in global CO2 levels in 2020. By combining OCO-2’s high-resolution data with modelling and data analysis tools from NASA’s GEOS, researchers determined which monthly changes were due to human activity and which were due to natural causes.
Measurements showed that in the Northern Hemisphere, human-generated growth in CO2 concentrations dropped from February through May 2020 and rebounded during the summer, consistent with a global emissions decrease of 3% to 13% for the year.
Notably, this detection method allows the changes in atmospheric CO2 to be detected just a month or two after they happen, providing fast, actionable information.
The Inverse Correlation of Population and CO2
Counterintuitive or not, OCO-2 data provided the first direct evidence that as a city's population density increases, its per capita carbon dioxide emissions generally decrease.
Cities produce over 70% of global CO2 emissions. Scientists hypothesised that densely populated urban areas emit less CO2 per person due to energy efficiency factors. OCO-2 data, however, showed exceptions. Cities with power generation facilities, like Yinchuan and Johannesburg, had higher emissions than expected for their population density. Wealthier cities, like Phoenix, also produced more emissions per capita compared to less affluent cities like Hyderabad.
 A spatial map of the amount of carbon dioxide (CO2) present in columns of the atmosphere below NASA's Orbiting Carbon Observatory-2 (OCO-2) satellite as it flew over Las Vegas on 8 February 2018. Warmer colours over the city centre indicate higher amounts of carbon dioxide Credit: NASA/JPL-Caltech/University of Utah
Linking El Nino to Record Droughts
The last El Nino in 2015-16 impacted the amount of carbon dioxide that Earth's tropical regions released into the atmosphere, leading to Earth's recent record spike in atmospheric carbon dioxide. The effects of the El Nino were different in each region. Credit: NASA-JPL/Caltech.
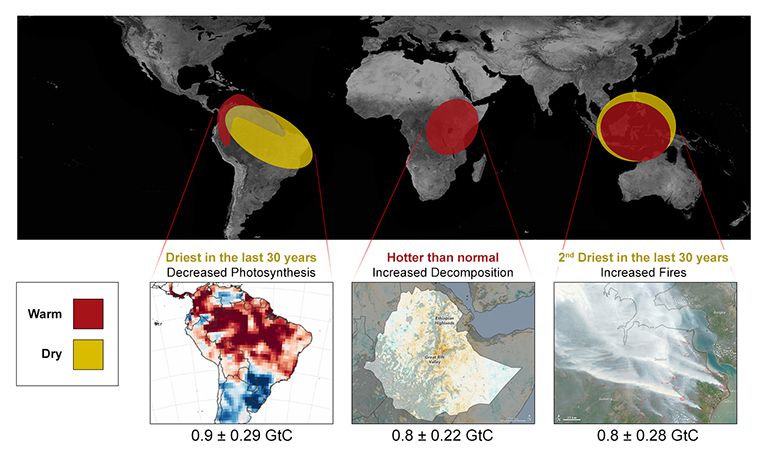
A NASA study proved that tropical regions were responsible for the largest annual increases in atmospheric carbon dioxide concentrations in at least 2,000 years. Scientists had long suspected the 2015-2016 El Niño — one of the strongest on record — as the cause but lacked a detailed understanding. OCO-2 data led researchers to conclude that heat and drought from El Niño in tropical areas of South America, Africa, and Indonesia were the main contributors to the record spike in global CO2.
In 2015-2016, OCO-2 recorded a sharp rise in atmospheric CO2 – 50% higher than usual – despite stable human emissions. This increase, aligned with NOAA data, was largely due to El Niño’s contribution to the 2.5 gigatons of natural carbon releases from tropical forests in South America, Africa, and Indonesia. carbon came from tropical forests. In South America, droughts reduced photosynthesis; in Africa, heat sped up decomposition; and in Asia, fires in Indonesia raised emissions.
In eastern and southeastern tropical South America, including the Amazon rainforest, severe drought spurred by El Nino made 2015 the driest year in the past 30 years. Combined with higher-than-normal temperatures, vegetation suffered, reducing photosynthesis and decreasing carbon sequestration.
In contrast, tropical Africa's rainfall was normal, but the region also experienced hotter-than-normal temperatures. Meanwhile, tropical Asia had the second-driest year in the past 30 years.
A-Train Synergy
OCO observes the spectrum of molecular oxygen, referred to as the A-band spectrum – a relatively constant fraction of the atmosphere used as a reference for measuring other gases.
The A-band also records the optical path – how far sunlight has travelled before reaching the satellite. That information is essential to locating CO2 sources and sinks, so if the distance is off by the slightest of margins, serious errors will be caused in the satellite’s measurements of column-integrated CO2 concentration. Often clouds and aerosols in Earth’s atmosphere reflect some sunlight back toward space before it reaches the surface, shortening sunlight’s path and confusing the spectrometer about the distance to Earth. However, CALIPSO and CloudSat’s data about the location and height of aerosols and clouds can verify OCO-2’s path-length measurements and determine what kept the sun from reaching Earth’s surface.
After an earlier mission extension, OCO-2 is running low on fuel and is scheduled for decommissioning in September 2026.
This article is the 3rd of a four-part series covering Teledyne Space Imaging's contributions to the A-Train:
- Aura
- CALIPSO
- PARASOL Polarization & Anisotropy of Reflectances for Atmospheric Sciences coupled with Observations from a Lidar)

