 Weather forecasts are for more than just dressing comfortably for the temperature. They are absolutely necessary for protecting economic infrastructure and – more importantly – human health and safety.
The US-based National Ocean and Atmospheric Administration (NOAA) seeks to understand and predict changes in Earth’s climate, weather, ocean, and coasts. One of NOAA’s branches – the National Weather Service (NWS) – provides essential weather forecasts to help people prepare and respond to natural and human-caused events.
GOES-16 recorded the solar eclipse that took place on December 14, 2020. Credit: NASA Earth Observatory, video and images by Joshua Stevens, using GOES 16 imagery courtesy of NOAA/NESDIS and umbral shadow calculations from NASA/GSF
The primary tool of the NWS is the Geostationary Operational Environmental Satellite (GOES) program. Like NASA’s A-Train, GOES is a satellite constellation designed to work in coordination. It comprises two meteorological satellites in geostationary orbit with a third satellite in a storage orbit to ensure rapid recovery from a failure of either of the operational satellites.
GOES-East is positioned at 75º W longitude over the equator, and GOES-West is positioned at 137º W longitude over the equator plane. This setup extends coverage of the planet from approximately 20º W longitude to 165º E longitude, covering the entirety of North and South America along with most of the Atlantic Ocean out to the west coast of Africa and part of the Pacific Ocean.
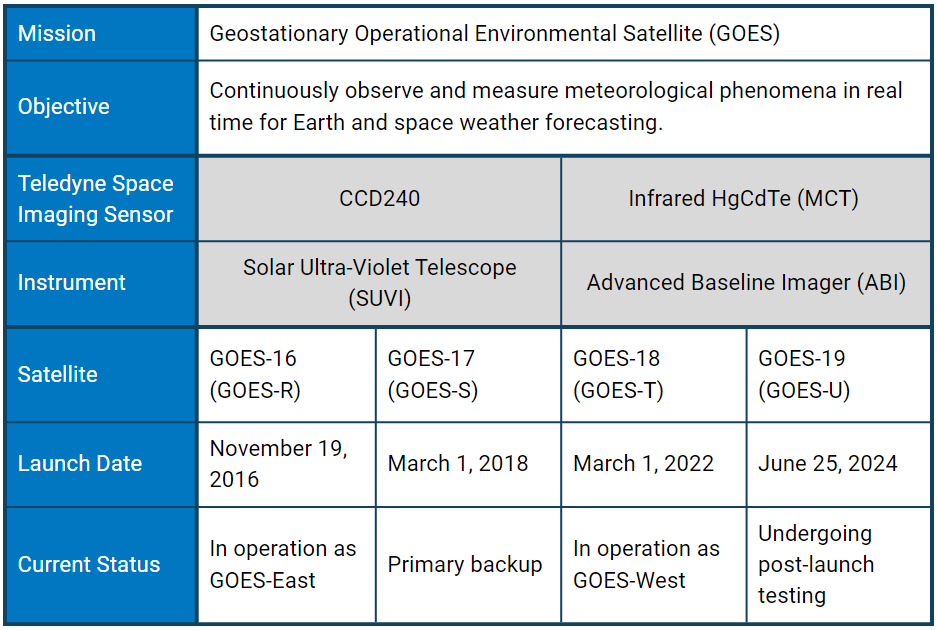
With the support of NASA, NOAA has launched 19 GOES satellites. Each GOES satellite is given a letter designation during the planning stages, which is changed to a number once in orbit. Sensors developed by Teledyne Space Imaging have flown on seven GOES satellites: GOES 13-15 (3rd generation) and GOES 16-19 (4th generation) – the focus of this article.
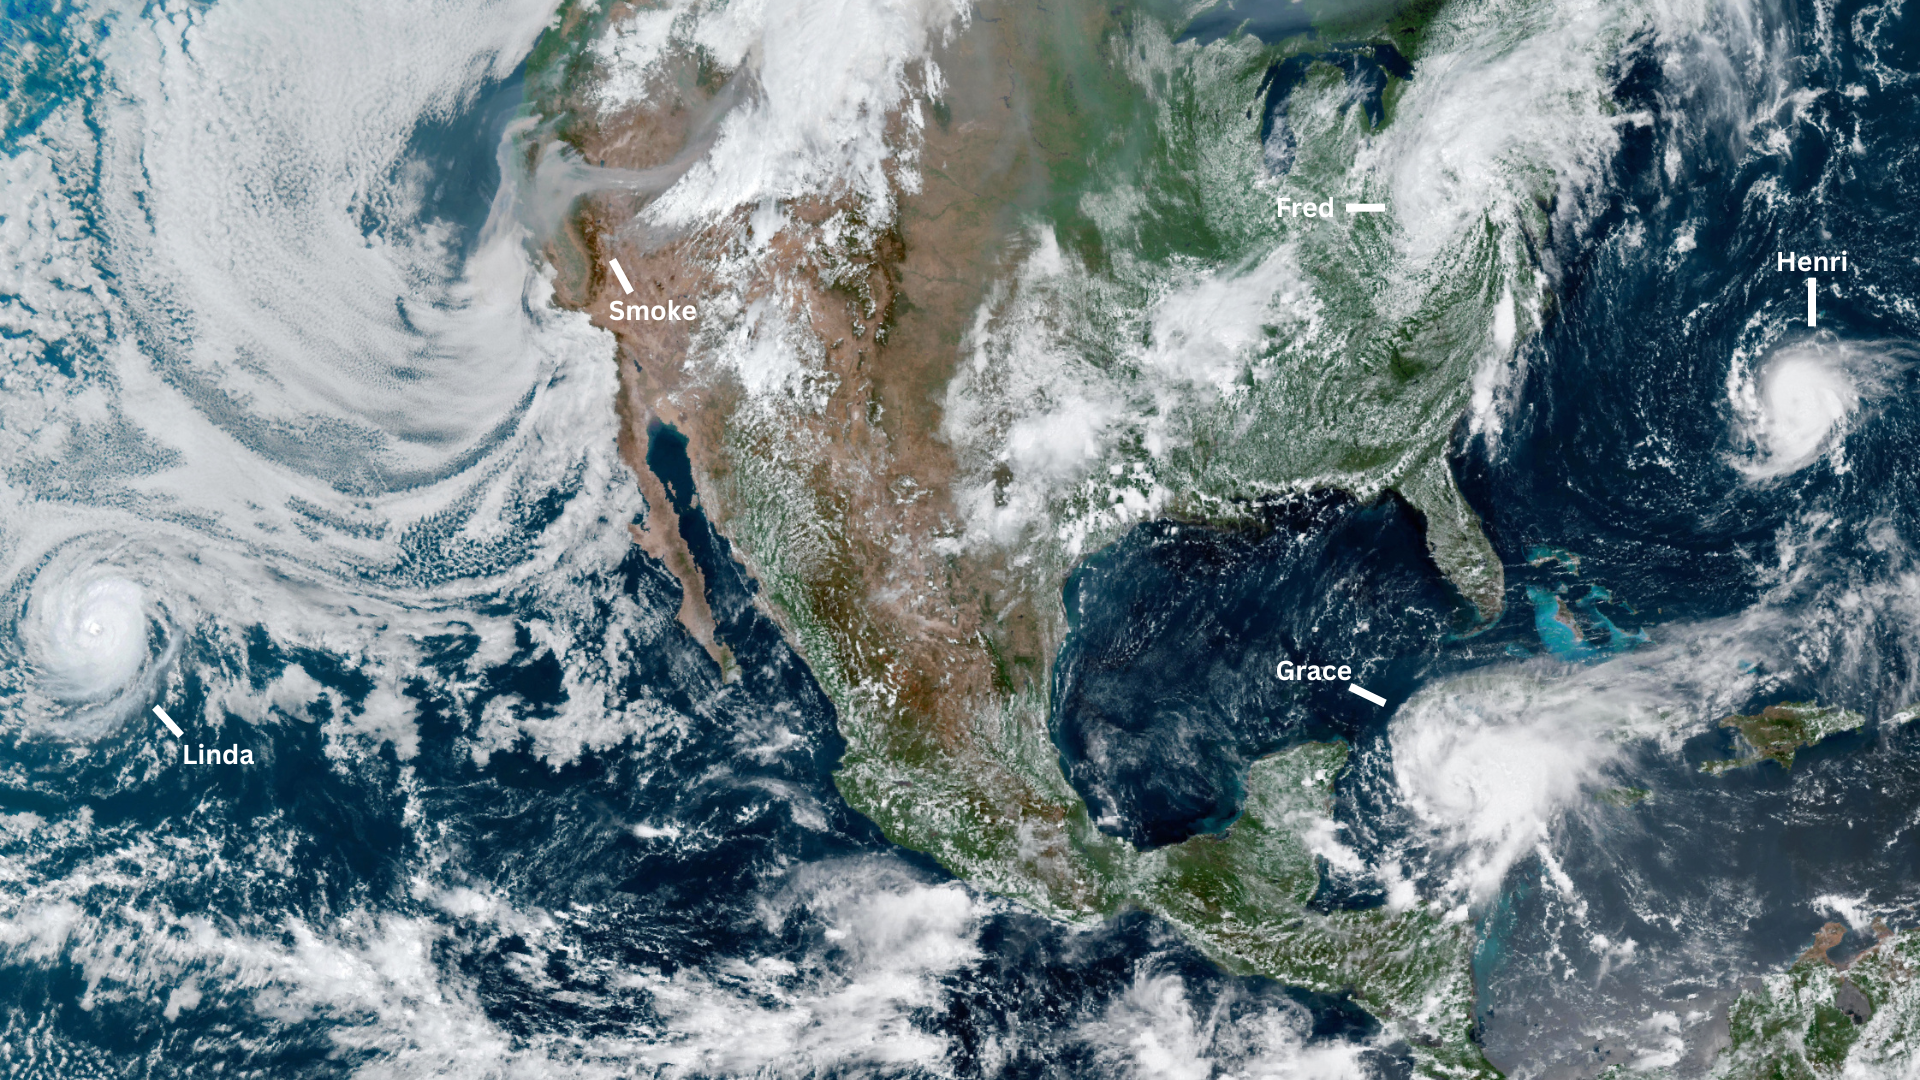 Taken Aug. 18, 2021, this GOES-16 image of North America show a variety of meteorological events. Hurricanes Grace and Linda, along with tropical storms Fred and Henri swirl around the continent, and smoke clouds from California wildfires streamin across the western U.S. Credit: NASA Earth Observatory image by Lauren Dauphin, using GOES 16 imagery courtesy of NOAA and the National Environmental Satellite, Data, and Information Service (NESDIS)
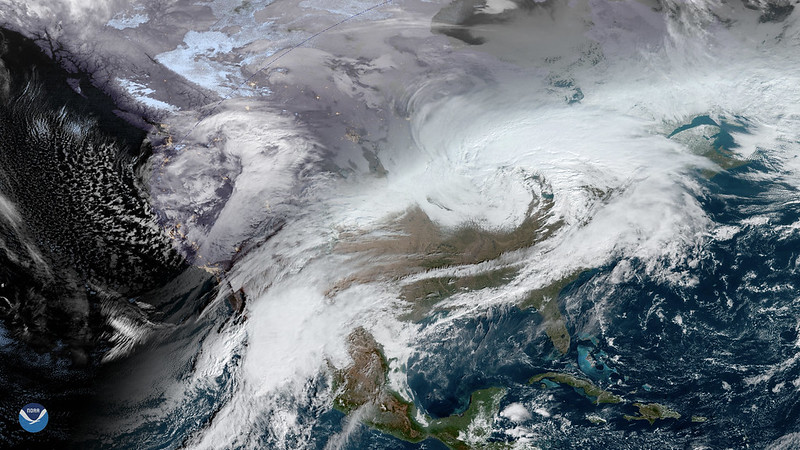 A series of winter storms, seen here in a combined GOES-16 (GOES East) and GOES-17 (GOES West) image on Nov. 27, 2019, making their way across the United States, greatly impacting travel for the Thanksgiving holiday. Credit: NOAA
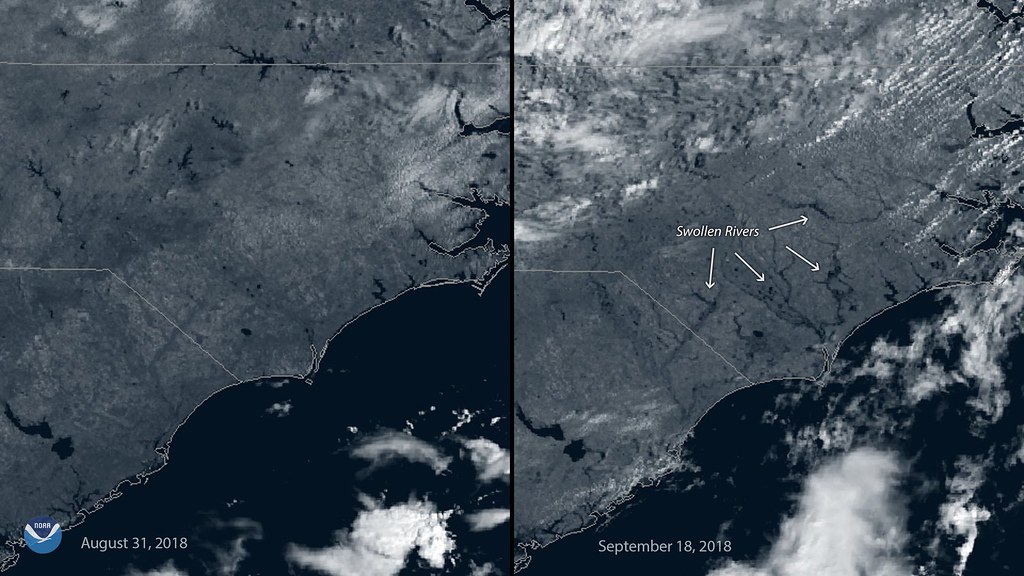 These two images, captured by the GOES East (GOES-16) satellite on August 31 and September 18, show how the landscape changed before and after Florence inundated the region. In the right hand image, several swollen rivers and tributaries appear in southeastern North Carolina, where widespread rainfall totals above 20 inches were recorded during the storm. Credit: NOAA
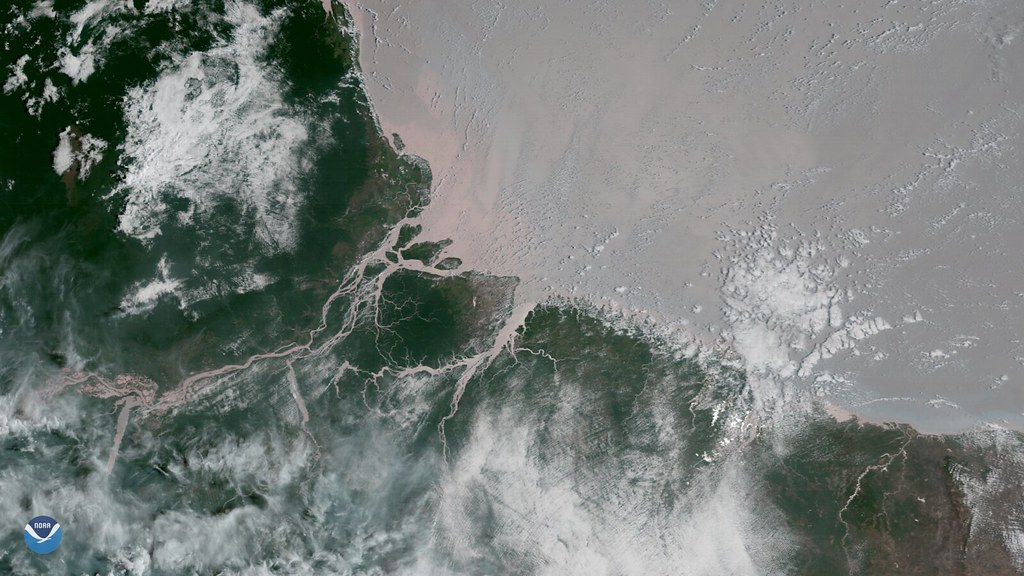 Scientists discovered a coral reef system at the mouth of the Amazon River, captured here by GOES-16 at on October 2, 2017. The thick and muddy environment is not one usually associated with coral reefs. NOAA’s Coral Reef Watch, a part of NESDIS' Center for Satellite Applications and Research, uses data from NOAA satellites to monitor the sustained, high ocean temperatures that cause coral bleaching around the world. Credit: NOAA
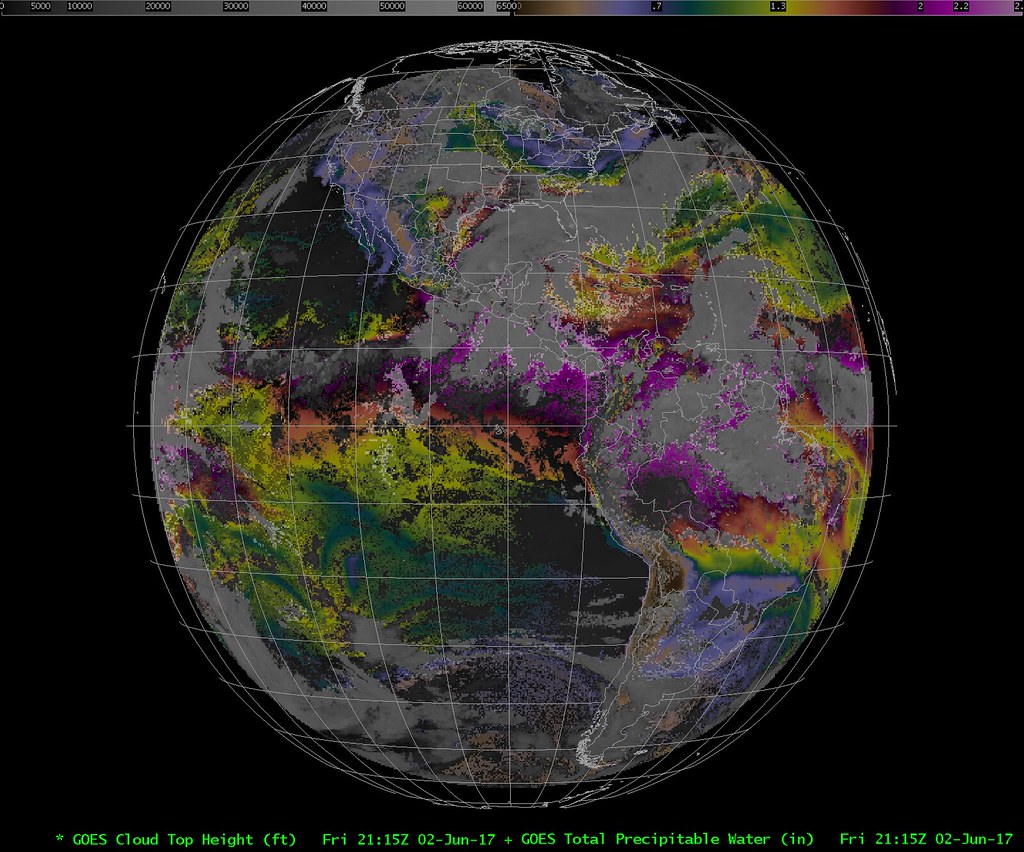 This image displays the total precipitable water and cloud top height applied to ABI full disk imagery on June 2, 2017. The coloured areas show the amount of water vapour, and the height of clouds is depicted in grayscale. Cloud top height allows forecasters to determine areas of cloud growth and likelihood of precipitation. Credit: Cooperative Institute for Meteorological Satellite Studies
Along with progressive improvements to image quality, the 4th generation increases both the observed spectral range and the rate of image acquisition. Higher detail enables more accurate weather forecasts – terrestrial and space. A wider spectral range allows scientists to evaluate various elements found on and around the Earth – such as vegetation, water, smoke, clouds, and solar radiation – data used to track cloud formation, atmospheric convection, land surface temperature, ocean dynamics, and many other natural phenomena. A higher image rate accelerates real-time coverage of dynamic short-lived events such as severe local storms, tropical cyclones, and hurricanes.
The imaging capabilities of GOES 4th generation decrease the time it takes to capture a full disc image from 26 to 5 minutes and increase the number of spectral channels from 5 to 16. This improved sensitivity allows GOES to collect observations during solar eclipses, which helps reduce data blackouts from hundreds of hours to less than three hours per year.
Also known as the GOES-R series, GOES 4th generation collects data for atmospheric and climate sciences research, maritime forecasts, seasonal predictions, drought outlooks, aviation flight route planning, weather prediction models, and improved solar flare warnings for communications and navigation disruptions.
Infrared imagery of the powerful storm system brought hail and tornadoes to the Southeastern U.S. on April 5, 2017. Taken by a novel one-minute scan, the imagery produced by this band offers spectacular detail of meteorological phenomena, such as the colder cloud tops (shown in green/yellow/red) associated with these storms. Credit: NOAA
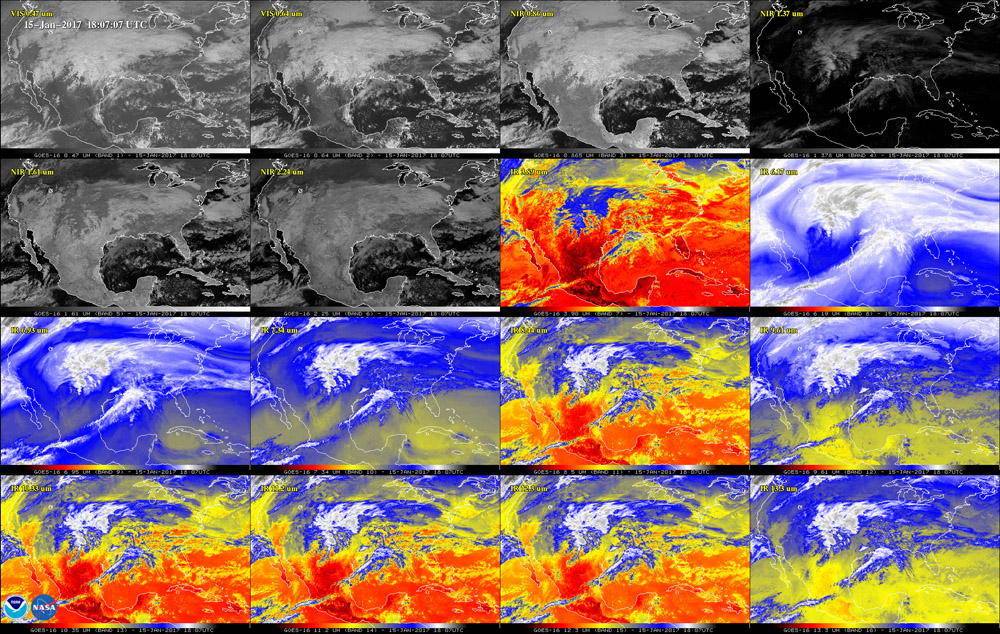
This 16-panel image from GOES-16 shows the continental United States in the two visible, four near-infrared and 10 infrared channels on ABI. These channels help forecasters distinguish between differences in the atmosphere like clouds, water vapor, smoke, ice and volcanic ash. Credit: NOAA and NASA
The Advanced Baseline Imager (ABI) is a multi-channel passive imaging radiometer designed to observe the Western Hemisphere and provide variable area imagery and radiometric information of Earth’s surface, atmosphere and cloud cover. The workhorse of the GOES satellites, ABI delivers more than 65 percent of all mission data products offered by NOAA.
Each of the four satellites is equipped with an ABI consisting of four HgCdTe FPAs produced by Teledyne Imaging Space. Each FPA provides two-fold redundancy: separate Side 1 and Side 2 electronics and the availability of multiple columns of detectors within each electronics side.
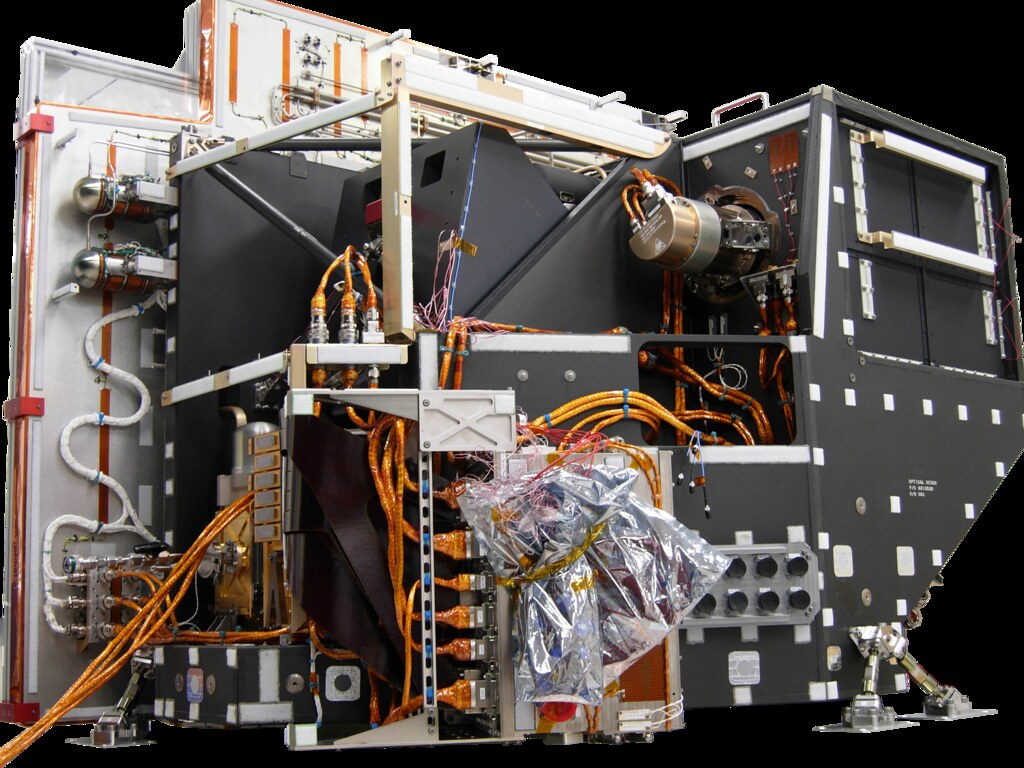 Sensor unit of GOES ABI. Credit: NOAA
Together, the 16 spectral bands recorded by ABI enable cloud, moisture, aerosol, and surface observation optimise various applications1.
Spectrum
| Approx. Central Wavelength (µm)
| Application
|
VIS
| 0.47
| Nearly continuous daytime observations of dust, haze, smoke and clouds. visibility estimation
|
VIS
| 0.64 | Daytime cloud imaging, snow and ice cover, severe weather onset detection, low-level cloud drift winds, fog, smoke, volcanic ash, flash flood analysis, hurricane analysis, winter storm analysis
|
NIR
| 0.86
| Determining vegetation amount, detecting burn scars to identify areas of fire and run-off potential, detecting islands, lakes, flooded regions and land/sea boundaries.
|
NIR
| 1.378
| Daylight detection of very thin cirrus clouds.
|
NIR
| 1.6
| Daytime cloud/snow/ice discrimination, total cloud cover, aviation weather analysis for icing, smoke from low-burn-rate fires
|
NIR
| 2.2
| Estimating cloud and aerosol particle size, fire detection, cloud masking and phase, icing threat forecasts
|
MWIR
| 3.9
| Fog and low-cloud discrimination at night, fire identification, volcanic eruption and ash, daytime reflectivity for snow/ice
|
MWIR
| 6.2
| Tracking upper-tropospheric winds, identifying jet streams, forecasting hurricane track and mid-latitude storm motion, monitoring severe weather potential, identifying regions subject to turbulence. One of three water vapor bands.
|
MWIR
| 6.9
| Tracking middle-tropospheric winds, identifying jet streams, forecasting hurricane track and mid-latitude storm motion, monitoring severe weather potential, estimating mid-level moisture, identifying regions where turbulence might exist. One of three water vapour bands.
|
TIR
| 8.4
| Detection of volcanic clouds with sulfuric acid aerosols, detection of thin cirrus clouds, determination of cloud phase using the brightness temperature difference between the 8.5 µm and 11.2 µm bands
|
TIR
| 9.6
| Examination of dynamics of the atmosphere near the tropopause. Ozone band.
|
TIR
| 10.3
| Atmospheric moisture corrections, characterising cloud and other atmospheric features, estimation of cloud top brightness temperature and cloud particle size
|
TIR
| 11.2
| Continuous day/night cloud analysis for general forecasting applications, precipitation estimates, severe weather analysis and prediction, cloud drift winds, hurricane strength and track analysis, cloud top heights, volcanic ash, winter storms, cloud phase/particle size
|
TIR
| 12.3
| Continuous cloud monitoring for numerous applications, low-level moisture, volcanic ash trajectories, cloud particle size
|
TIR
| 13.3
| Cloud top height assignments for cloud-drift winds, cloud opacity
|
Flexible Image Acquisition
ABI collects Earth scene data swath by swath in an east/west direction and builds the image from successive swaths in a north/south direction. Due to the operational flexibility of ABI, swaths from multiple scenes can be interleaved. Note: the true color images as shown in the video, are acquired by combining data from multiple ABI channels to approximate what the human eye would see from space. Credit: Harris
The instrument features three “imaging sectors” with a simultaneous observation capability. Depending upon the configured sequence, ABI produces a full disk of the Western Hemisphere at 5, 10, or 15-minute intervals, a CONUS (Contiguous USA) image – resolution 3000 km by 5000 km – at five-minute intervals, and two mesoscale domains – resolution 1000 km by 1000 km – at 60-second intervals. The smaller mesoscale images provide detailed views of storm activity at a regional scale.
One of the ABI’s major innovations is the ability to interleave images of different sizes, locations, and repetition intervals. This increased operational flexibility ensures that all regions will be imaged far more frequently and with greater detail and sensitivity. Interleaving capability optimises image calibration of Earth-based calibration targets – such as moons and deserts – without interrupting full disk and mesoscale collections. As seen in the video above, ABI’s IR channels are also used for star identification to calculate the satellite location.
The Solar Ultraviolet Imager (SUVI)
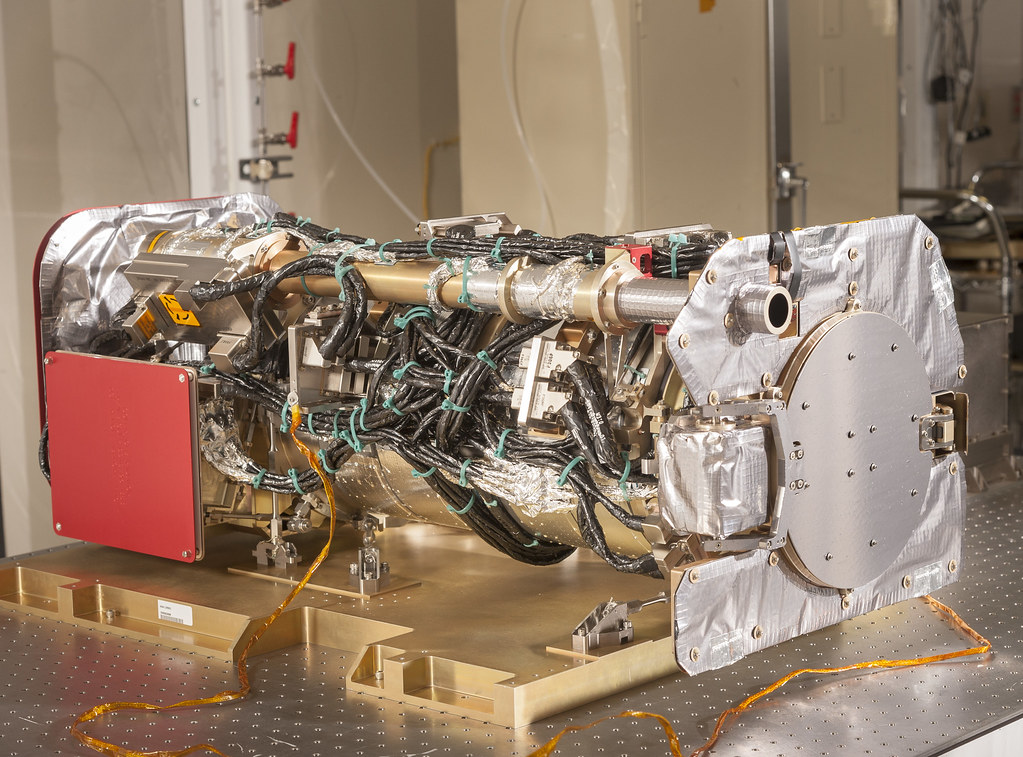 Completed SUVI instrument. Credit: NOAA and Lockheed Martin Corporation
Space weather also impacts the Earth. Geomagnetic storms generated by the Sun can disrupt the electrical grid, and satellites, which can interrupt essential services like weather prediction, radio communication for search and rescue, cell phones, navigation, military surveillance, and financial transactions.
The source of the most disruptive storms is large expulsions of plasma and magnetic energy called coronal mass ejections (CMEs). Churning plasma inside the Sun generates magnetic fields that loop through the sun in ever tighter twists and coils until they “snap” in an event known as a magnetic reconnection. The electromagnetic energy released creates a solar flare, which – if powerful enough – will produce a CME wave of highly charged particles. Coronal holes can also produce storms, releasing intense solar winds that interact with Earth’s magnetosphere.
With the temperature of the solar corona ranging from 1 to 3 million degrees Kelvin, it is best observed with X-ray and extreme-ultraviolet (EUV) cameras. Each satellite is equipped with the Solar Ultraviolet Imager (SUVI), upgrading the spectral coverage and spatial resolution of the Solar X-Ray Imager on the GOES 3rd generation.
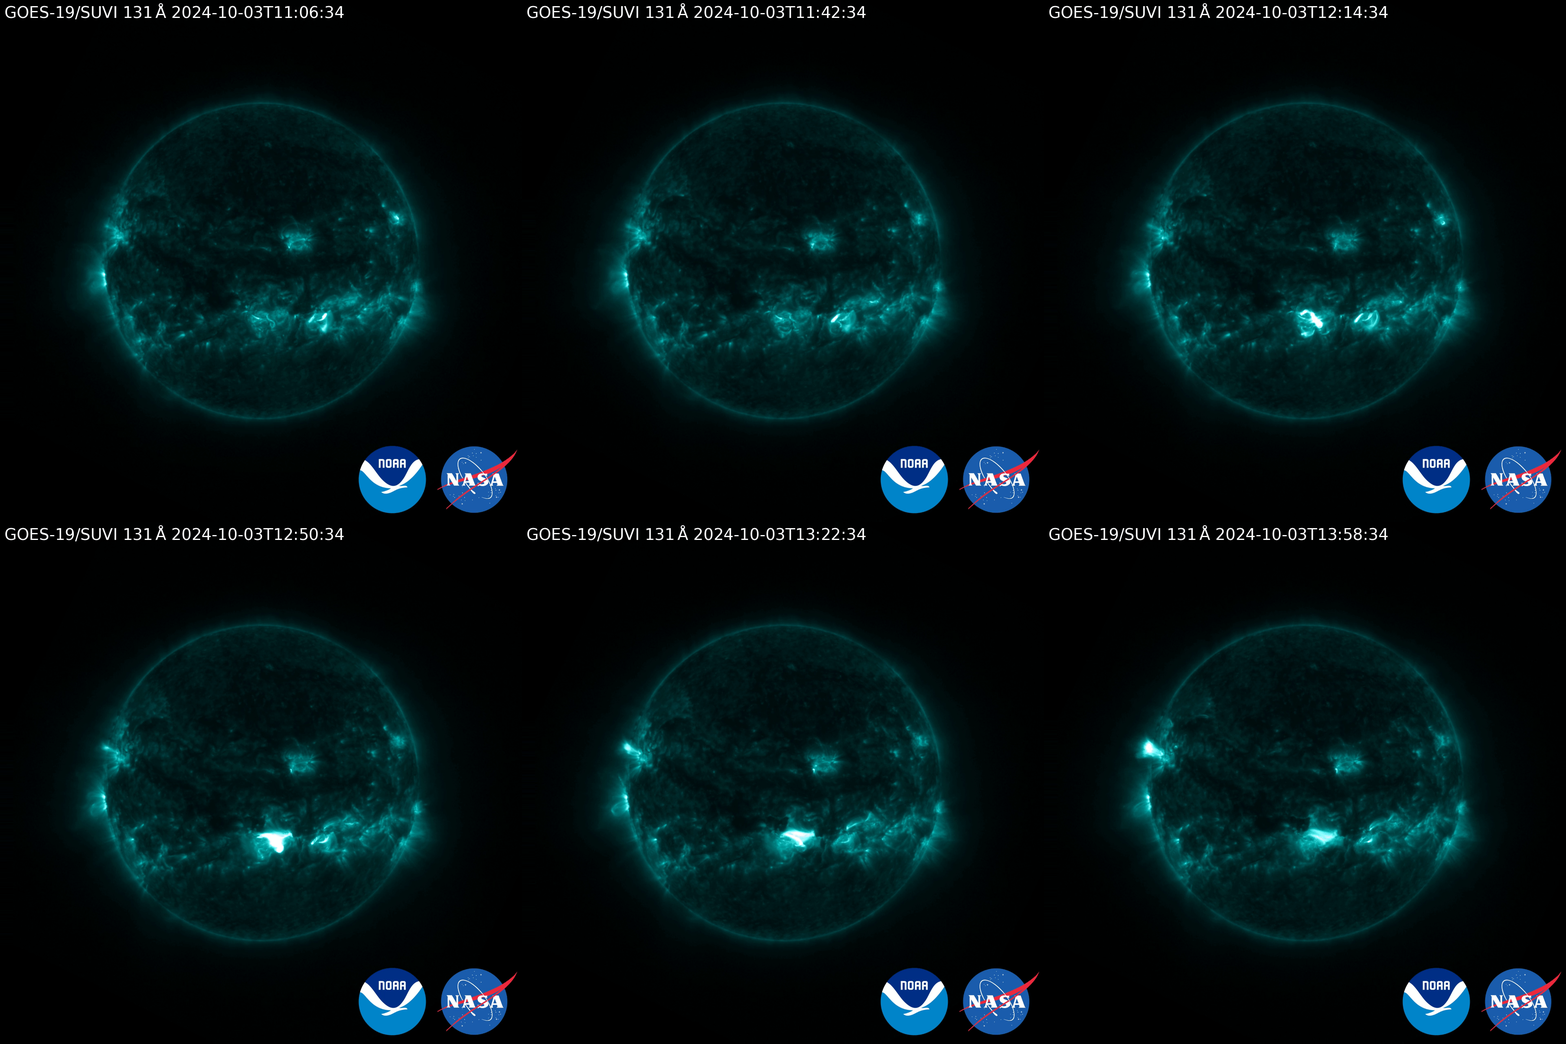 GOES-19's SUVI captured an X9 flare on Oct. 3, 2024. X-class flares are the strongest category of flares, and the number gives more information about a flare’s strength. The stronger the flare, the higher the change it creates a destructive space storm. Credit: NOAA and NASA
As part of the GOES Space Environment Monitor (SEM) package, SUVI uses narrowband observations, exposure settings, and filters to compile full disc images of the solar corona in six distinct X-ray bands from 94 to 304 Angstroms. Images are acquired at a high cadence of up to three full discs per second. This helps scientists predict and track sunspots, solar flares and eruptions of solar filaments as they rotate onto the disk from the east limb and beyond the west limb. Accordingly, SUVI helps predict the formation and intensity of active solar regions to evaluate their potential for creating harmful space storms.
Consistent and accurate monitoring of the coronal plasma temperatures and high-speed solar wind streams improves the forecasts generated by the NOAA Space Weather Prediction Center to help electric power companies, telecommunication providers, and satellite operators prevent costly damages caused by geomagnetic storms. An Economic Benefit Analysis conducted by the Eastern Research Group in 2020 concluded that NOAA’s space weather forecasting services mitigated $111 million for minor geomagnetic disturbances, and up to $27 billion for severe geomagnetic storms.
Each SUVI instrument features a Teledyne-e2v 1280×1280 back-thinned and back-illuminated CCD240 detector with 21 um pixels and 2.5 arc-second pixels, and non-inverted operation to ensure good full well capacity. The CCD240 is a design similar in construction to instruments on the Solar-B/Hinode and the Solar Dynamics Observatory.
The Future of GOES
The GOES 4th generation spacecraft are designed for 10 years of on-orbit operation preceded by up to five years of on-orbit storage. With the successful launch of GOES-19, the operational lifetime of the GOES programme has been extended to December 2036. NOAA’s National Centers for Environmental Information maintains data from the GOES programme.
Works Cited
National Oceanic and Atmospheric Organization (NOAA). (Feb. 19, 2025). Safeguarding Satellites: How NOAA Monitors Space Weather to Prevent Disruptions. US Department of Commerce.
https://www.nesdis.noaa.gov/news/safeguarding-satellites-how-noaa-monitors-space-weather-prevent-disruptions
Yu, F., Wu, X., Yoo H., Haifeng Qian, H., Shao, X., Wang, Z., Lacovazzic, R. (Dec. 10, 2021). Radiometric calibration accuracy and stability of GOES-16 ABI Infrared radiance.Journal of Applied Remote Sensing. https://repository.library.noaa.gov/view/noaa/41794/noaa_41794_DS1.pdf
Darnel, J., Seaton D. B., Bethge, C., Rachmeler, L., Jarvis, A., Hill, S., Peck, C., Hughes, M., Shapiro, J., Riley, A., Vasudevan G., Shing, L., George Koener, G., Edwards, C., Mathur, D., Timothy, S. (November 21, 2022).The GOES-R Solar UltraViolet Imager. Space Weather. https://d197for5662m48.cloudfront.net/documents/publicationstatus/97631/preprint_pdf/4b9c78190af4a78
Harvey, J. E., & Choi, N. (Sep. 26, 2013). Effect of surface scatter upon the MTF of the solar ultra violet imager (SUVI) telescope. Proceedings of SPIE. https://doi.org/10.1117/12.2026978
1Data Table:
- eoPortal. (July 2, 2024). GOES-R (Geostationary Operational Environmental Satellite-R). eoportal.org. https://www.eoportal.org/satellite-missions/goes-r#abi-advanced-baseline-imager
- National Aeronautics and Space Administration (NASA). (May 2019). GOES-R Series Data Book. https://www.goes-r.gov/mission/ABI-bands-quick-info.html

