The Sun governs the structure and energy of the solar system, yet some of its most consequential processes occur in a region that is difficult to observe. Between the surface and the extended outer atmosphere lies a dynamic interface where energy and matter move through rapidly changing conditions. Understanding this region is essential to explaining how the Sun works, and how solar activity affects the Earth.
Energy originates in the Sun's core, where hydrogen fuses into helium. It travels outward and emerges from the photosphere - the visible surface - at about 5,500 °C (10,000 °F). The energy then continues through the lower atmosphere - the chromosphere - reaching temperatures of roughly 20,000 °C (36,000 °F). By the time that energy reaches the outer edge of the solar atmosphere - the corona - temperatures rise sharply to about one million kelvins or more. This steep increase runs counter to the expectation that the atmosphere should simply cool with distance from the Sun's interior. Further confusing the issue, the chromosphere is much denser than the corona, meaning that it requires a heating rate that is between one and two orders of magnitude larger than that of the corona.
The chromosphere is not merely a boundary between two atmospheric layers. It is where much of the energy and mass that comprises the heliosphere - the vast region of space influenced by the solar wind - is transformed and redistributed. Magnetic fields and plasma exert comparable influence there, creating a complex environment marked by steep temperature and density changes, rapid motions, and interactions between waves and magnetic structures. Almost all of the mechanical energy that drives solar activity and solar atmospheric heating is converted into heat and radiation within this interface region, with only a small amount leaking through to power coronal heating and drive the solar wind. The plasma also changes character: it is only partially ionized in parts of the chromosphere but becomes fully ionized in the corona.
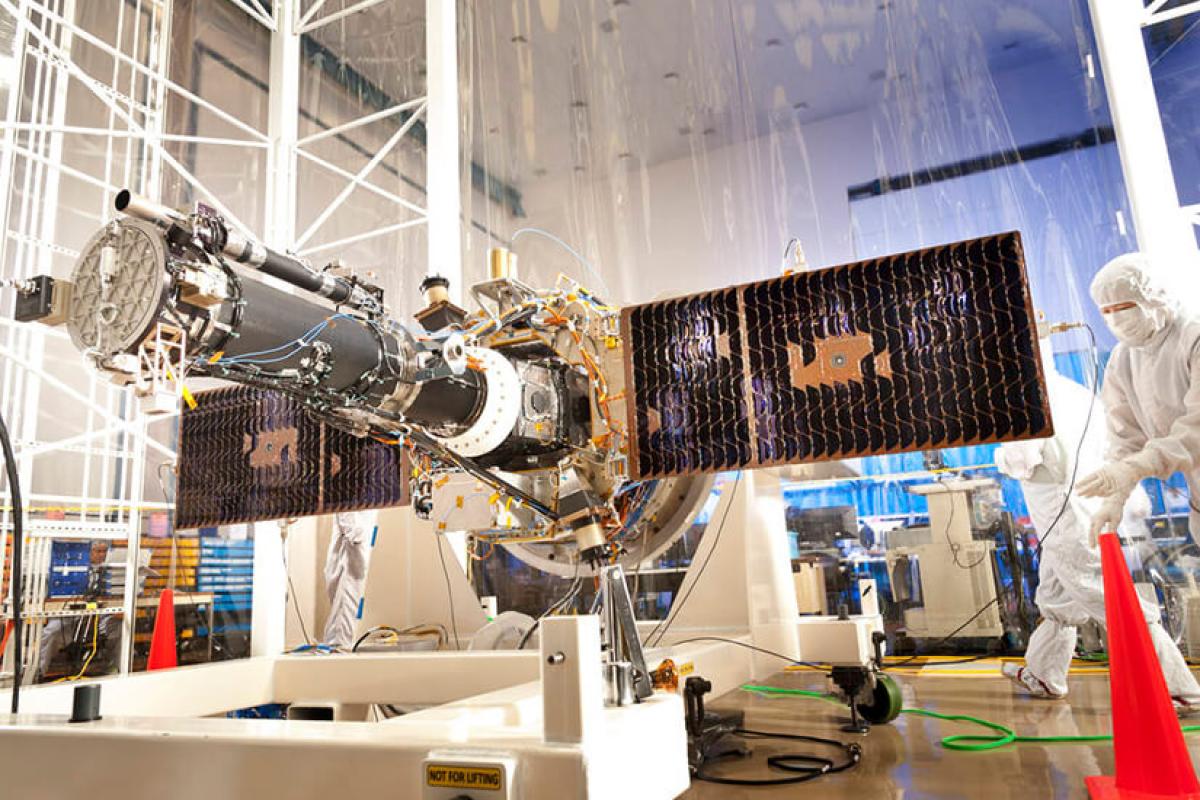
In this photograph, engineers and scientists prepare NASA's Interface Region Imaging Spectrograph (IRIS) before its launch. Credit: NASA/Lockheed Martin
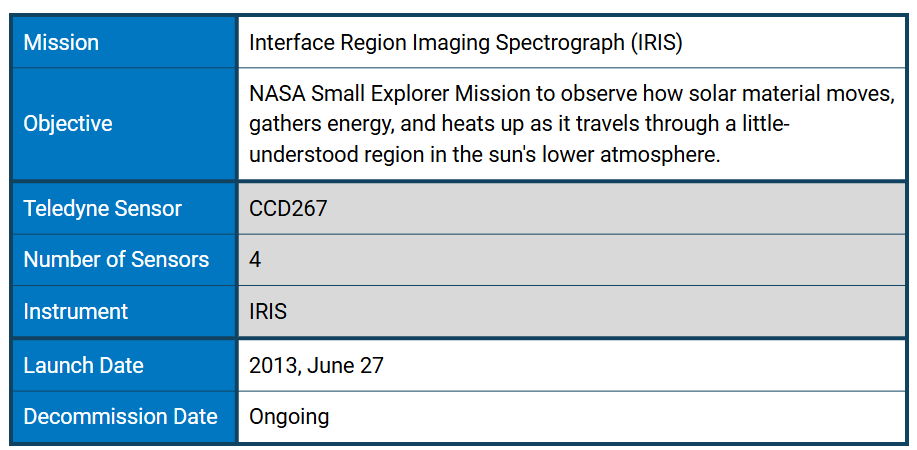
NASA's Interface Region Imaging Spectrograph (IRIS) is designed to investigate this difficult-to-study zone. It collects high-resolution UV spectra - which show how much light is present at different wavelengths - and images of the chromosphere at a high cadence. Those measurements reveal information about the plasma's temperature, composition, and motion. IRIS observes the interface region at fine spatial and temporal scales - down to fractions of an arcsecond and, for some measurements, roughly one-second intervals - allowing researchers to follow processes that change quickly and across small areas. Part of NASA's Small Explorer programme, the satellite is in a Sun-synchronous, polar orbit enabling it to collect continuous observations over 8 months each year.
IRIS's observations are interpreted alongside sophisticated three-dimensional computer simulations using supercomputers at NASA's Ames Research Center and other facilities in the USA and Norway. Together, the data and models help scientists trace how energy and plasma move from the solar surface into the corona. Researchers are particularly interested in how magnetic structures rise through the lower atmosphere and how that process may contribute to flares and coronal mass ejections (CMEs), which are responsible for potentially damaging space storms. The interface region produces much of the Sun's ultraviolet emission, which influences Earth's upper atmosphere and near-Earth space. Its processes also help drive the solar wind and shape space weather, including disturbances that can affect technological systems. By clarifying how the Sun transfers energy and matter into its outer atmosphere, IRIS contributes to a broader understanding of the connections between the Sun, Earth, other planets, and the surrounding interstellar environment.
Furthermore, IRIS complements other heliophysics missions, also running on Teledyne technology: Solar Dynamics Observatory (SDO), Hinode, GOES 4th and 3rd Generation, SUIT, and STEREO.
Interface Region Imaging Spectrograph
The IRIS instrument is a multi-channel imaging spectrograph with a 20 cm (8 in) UV telescope. The telescope provides high-resolution images, able to resolve very fine features as small as 250 km (150 mi) across. The spectrograph splits the sun's light into its various wavelengths and measures how much of any given wavelength is present. Analysis of these spectral lines provides velocity, temperature and density data, key information that is enabling scientists to track how energy and heat moves through the chromosphere.
IRIS utilises four Teledyne, 1096 x 2072, thinned, back-illuminated CCD detectors (CCD267). The CCDs have 1/6 arcsec pixels producing an effective spatial resolution between 0.33 and 0.4 arcsec and a maximum field of view of 120 arcsec. Such high resolution means that IRIS can essentially act as a microscope for other heliophysics missions. The instrument captures a new image every five to ten seconds, and spectra about every one to two seconds.
The slit-jaw spectrograph features a slit that is 0.33 arcsec wide and 175 arcsec long onto a grating that is sensitive in both FUV and NUV passbands:
Far Ultraviolet (FUV1): 1331.56–1358.40 Å
Far Ultraviolet (FUV2): 1390.00–1406.79 Å with 40 mÅ resolution and an effective area of 2.8 cm²
Near Ultraviolet (NUV): 2782.56–2833.89 Å with 80 mÅ resolution and an effective area 0.3 cm²
How IRIS Works
Monitoring of specific spectral lines provides additional information on
the velocity - and therefore temperature - of plasma in the observed region. In the
visualization presented here, the IRIS slit-jaw imager takes images with two
different filters, one at 1330 Angstroms (gold color table), the other at 1400
Angstroms (bronze color table), and these images are displayed overlaying
corresponding imagery from the Solar Dynamics Observatory (SDO) 304 Angstrom
filter. The spectra is presented on a semi-transparent plane perpendicular to
the images, at the position of the slit in the imager. This allows scientists
to compare and correlate structures seen in images with speeds and temperatures
of the plasma. The black line moving across the image is produced by the
slit-jaw imager and allows researchers to examine specific wavelengths. Credit:
NASA's Scientific Visualization Studio
Understanding Coronal Heating
The data collected by IRIS shows the solar interface region in unprecedented detail, revealing dynamic magnetic structures and flows of material in the Sun's atmosphere and hint at tremendous amounts of energy transfer through the region.
The IRIS high-resolution spectra have shown for the first time the existence of regions of very dense plasma in the chromosphere that are rapidly accelerated and heated. This discovery has pushed numerical simulations to explore specific reconnection processes that explain these newly observed features and their impact regarding the mass and energy supply for the corona. The observations reveal enormous contrasts in density and temperature throughout this region, even between neighboring loops only a few hundred miles apart.
Scientists have largely debated two possible explanations for coronal heating: nanoflares and electromagnetic waves. The nanoflare theory proposes bomb-like explosions, which release energy into the solar atmosphere. An alternative theory suggests a type of electromagnetic wave called Alfvén waves might push charged particles into the atmosphere like an ocean wave pushing a surfer. Supported by IRIS data, scientists now think the corona may be heated by a combination of phenomenon like these, instead of a single one alone.
Nanojets
IRIS collected the first clear images* of nanojets —bright, thin lights
of heated plasma that travel perpendicular to magnetic structures in the solar
atmosphere. They reveal the existence of nanoflares which contribute to coronal
heating. *Credit: NASA Goddard's Scientific Visualization Studio
The Sun's atmosphere is threaded by magnetic fields generated by churning plasma inside the star. These fields can twist, coil, and become increasingly stressed. Under enough stress, these fields undergo a mechanism called magnetic reconnection as magnetic field lines cross and explosively realign. Constant convection of material throughout the Sun, tangles magnetic fields that travel up to the surface and farther into the Sun's lower atmosphere. These magnetic field lines rapidly snap back into place to resolve the tension, expelling plasma and energy. This whip-like process also naturally generates Alfvén waves, a strong kind of magnetic wave key to heating the Sun's atmosphere and propelling the solar wind, which constantly bathes our solar system and planet with charged particles. On a large scale, reconnection is associated with solar flares, which can accelerate particles to nearly the speed of light and sometimes accompany CMEs.
A longstanding question is whether the same process, occurring on far smaller scales, helps explain why the solar corona is so hot. These events, called nanoflares, are tiny and brief compared with major flares, making them difficult to distinguish against the Sun's bright, dynamic atmosphere. Their cumulative energy release could nevertheless make them an important source of coronal heating. Detecting these particles offers clues to how magnetic energy is converted into high-energy electrons - a process that remains poorly understood and is relevant to many astrophysical environments.
Other IRIS findings reveal that the solar atmosphere is shaped by more than explosive events alone. Researchers found small-scale twisting motions in the chromosphere associated with plasma heating to transition-region temperatures. These motions are consistent with propagating Alfvén-wave pulses, which carry energy along magnetic fields and may help explain how energy moves through the atmosphere. The observations also offer insight into the transport of magnetic helicity, a measure of the field's twist and linkage.
Observations of energetic particles, nanojets, waves, and high-speed jets are refining scientists' picture of how the Sun's magnetic field transfers energy into its atmosphere. They provide important constraints on the mechanisms that may power the corona, drive the solar wind, and contribute to the solar eruptions that affect Earth.
Spicules
At any given moment, as many as 10 million wild jets of solar material
burst from the Sun’s surface. Known as spicules, they erupt as fast as 241,400
km/h (50,000 mph), and can reach lengths of 9,650 km (6,000 mi) before
collapsing. Spicules are transient,
forming and collapsing over the course of just five to 10 minutes. Now, for the
first time, a computer simulation - so detailed it took a full year to run - shows
how spicules form, helping scientists understand how they can break free of the
Sun’s surface and quickly surge upward. Credits: NASA’s Goddard Space Flight
Center/Joy Ng, producer
CME Observation
A coronal mass ejection burst off the side of the Sun on May 9, 2014.
The giant sheet of solar material erupting was the first CME seen by IRIS. The
field of view seen here is about five Earth's wide and about seven and a half
Earth's tall. Bright pixels that appear at the end of the video aren’t caused
by the solar flare, but occur when high-energy particles bombard IRIS’s CCD
camera. Credit: NASA Goddard Space Flight Center
Conclusion
Since its launch in June 2013, IRIS has taken more than 24 million images or spectral measurements of the Sun. Scientists have used IRIS to make exciting discoveries about what causes the heating of the solar atmosphere and how solar flares are triggered and release magnetic energy.
The IRIS data are available to the science community in each level of reduction as soon as they are available at the SDO JSOC (Joint Science Operations Center), where they are archived and processed. In addition, the modeling output are considered part of the IRIS mission data and made available for community analysis through the same distribution channel.
Works Cited
Bart De Pontieu, Jim Lemen and Milan Gošić. (2022, September 01). Introduction to IRIS operations. https://iris.lmsal.com/itn51/inst\_overview.html
Center for Astrophysics. (n.d.). Interface Region Imaging Spectrograph (IRIS). https://www.cfa.harvard.edu/facilities-technology/telescopes-instruments/interface-region-imaging-spectrograph-iris
eoPortal. (2013, January 21). IRIS (Interface Region Imaging Spectrograph). https://www.eoportal.org/satellite-missions/iris
Evans, Jessica. (2017, June 22). Scientists Uncover Origins of the Sun's Swirling Spicules. NASA. https://www.nasa.gov/solar-system/scientists-uncover-origins-of-the-suns-swirling-spicules/
Hatfield, Miles. (2021, February 19). NASA. NASA Missions Make Unprecedented Map of Sun's Magnetic Field. https://www.nasa.gov/missions/hinode/nasa-missions-make-unprecedented-map-of-suns-magnetic-field/
Megan Gannon. (2013, December 10). Space.com. https://www.space.com/23892-nasa-iris-spacecraft-sun-photos.html
NASA - Goddard Space Flight Center. (2026, October 27). IRIS - Interface Region Imaging Spectrograph. https://iris.gsfc.nasa.gov/
NASA. (2013, May 29). IRIS - Interface Region Imaging Spectrograph. https://www.nasa.gov/wp-content/uploads/2015/03/754677main\_iris-brochure.pdf
NASA - Heliodata. (2026, September 28). IRIS Data. https://helio.data.nasa.gov/mission/IRIS
NASA. (2013, July 25). IRIS Mission Gets First Look at Sun's Mysterious Interface Region. https://www.nasa.gov/news-release/iris-mission-gets-first-look-at-suns-mysterious-interface-region/
NASA Scientific Visualization Studio. (2017, June 22). Scientists Uncover Origins of Dynamic Jets on Sun's Surface. https://svs.gsfc.nasa.gov/12604/
NASA Scientific Visualization Studio. (202, September 21). NASA's IRIS spots Nanojets: Shining light on heating the solar corona. https://svs.gsfc.nasa.gov/13691/

