
The rupture of Europe’s Nord Stream gas pipeline resulted in the most significant human-caused release of methane, a potent greenhouse gas. Credit AP
In 2022, Europe’s Nord Stream gas pipeline ruptured and released up to 485,000 tonnes of methane into the atmosphere – equivalent to the global warming emissions from eight million cars driving for a year. Despite surpassing the previous record by five times, the large leak represented less than two days of methane emissions from the oil and gas industry as a whole.
Methane traps the Earth’s heat 80 times more effectively than carbon dioxide. Together, they account for around 90% of present-day global warming. Amid long-term efforts to decarbonise our energy systems, reducing methane emissions will have a short-term effect as methane does not stay in the atmosphere as long as CO2. Thus, international agreements such as the Paris Climate Accords or the Oil and Gas Decarbonization Charter and organisations like Satellites for Climate Action emphasise the important role that methane can play in demonstrably slowing the rate of planetary heating.
Ensuring compliance with these environmental policies means governments and industry partners need easy access to accurate and timely data maps to measure total emissions, pinpoint and quantify sources, and track the changes over time. Depending on the conditions, emissions can be highly variable or even intermittent. Scientists need sustained, high-frequency monitoring to better understand the behaviour and overall impact of emission sources.
What is Methane, and Where is It Coming From?
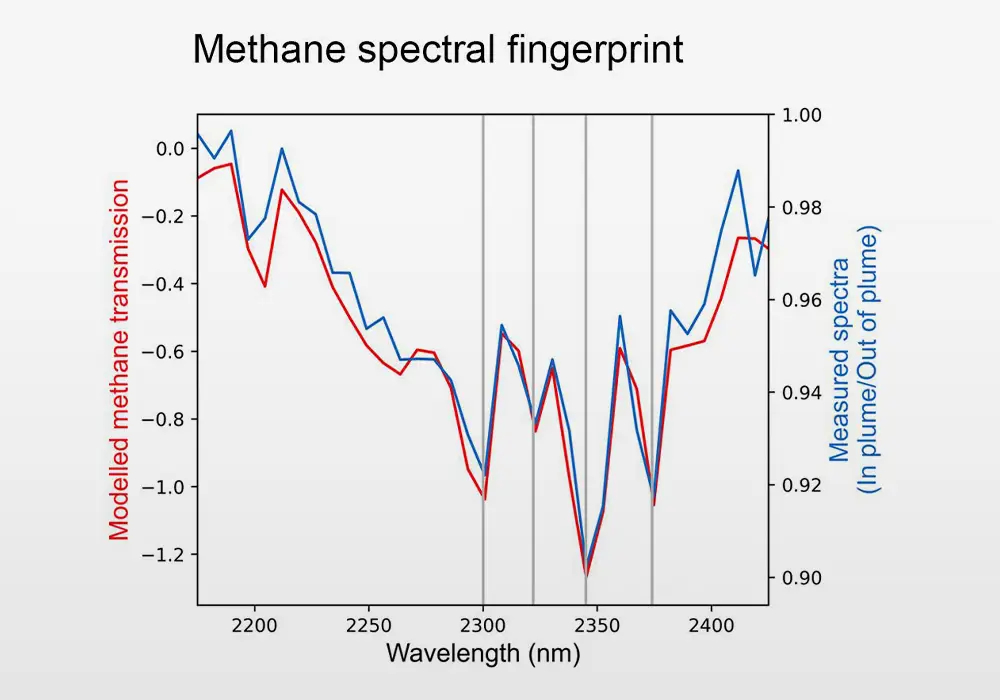
The absorption spectra of methane. Credit: NASA/JPL
Methane–a colourless and odourless gas–is the main ingredient in natural gas that is burned in power plants, factories, and homes worldwide. While there are some natural sources of methane, such as wetlands, the majority of methane emissions result from human activities: agriculture, fossil fuels, and decomposition of landfill waste.
The methods of harvesting, processing, and supplying oil and natural gas result in purposeful methane emissions through venting and flaring and unintentional leaks from pipelines, drill sites, gaskets, and pneumatic equipment. The leaks from abnormal operating conditions can be hard to detect as previous collection methods and available technology often combined all contributing sources across large geographies.
In fact, a 2018 study of the Permian Methane Analysis Project (PermianMAP)–compiled with data from ESA’s TROPOMI spectrometer on the Copernicus constellation–determined that methane emissions were 63% higher than the previous inventory estimate by the U.S. Environmental Protection Agency. If emission sources are undetected, they can’t be fixed, wasting a limited resource–about $2 billion/year–increasing global pollution and substantially eroding the potential climate benefits of natural gas use.
Earlier efforts involving aircraft and ground stations established proof of concept using spectrometers to map methane emissions accurately. However, their scope was limited, meaning overall emissions had to be calculated using representative samples rather than specific data collected across each area.
The First Non-Profit Satellite Programs
Two satellites launched in 2024 filled gaps in global and source-point methane detection. Leveraging the influence and resources of private companies, donors, and governments, MethaneSAT and Tanager-1 expand emission detection capabilities to improve greenhouse gas accounting, expedite leak mitigation, and support disaster response.
For the first time, scientists can survey a wide range of methane emissions at national and regional scales or zoom in on basin and sub-basin scales to find methane sources from large “super-emitters”--individual sources responsible for a significant fraction of global emissions–and thousands of smaller ones.
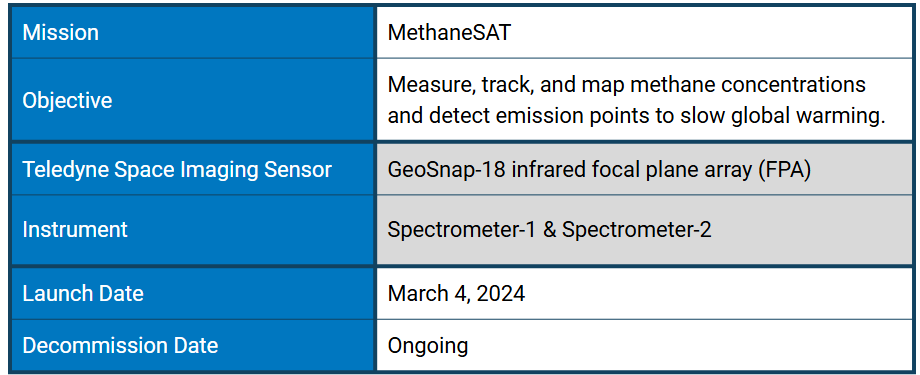
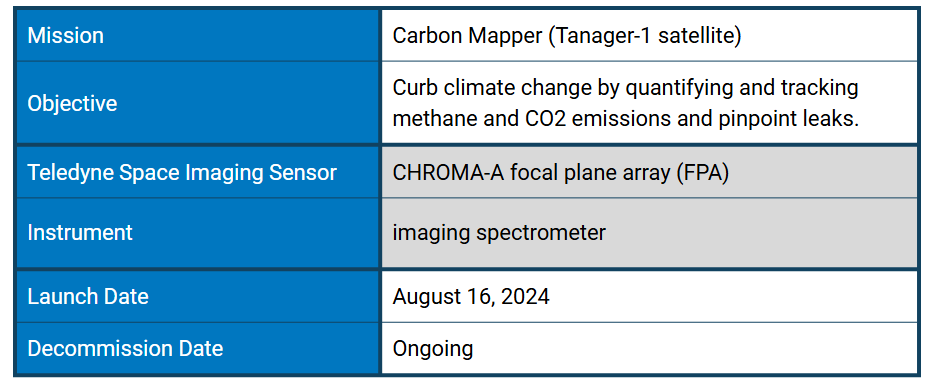
Launched March 4, 2024, MethaneSAT–developed by the Environmental Defense Fund (EDF)–was designed to track methane emissions at a global and local scale, enabling both countries and companies to manage their methane emissions. On August 16, 2024, Tanager-1 launched into space as the first satellite developed by the Carbon Mapper Coalition. Operated by Planet Lab PCB and supported by NASA JPL, Tanager-1 takes high-resolution images to trace methane emissions to individual facilities.
Their combination of high sensitivity, multiple spatial resolutions, and frequent sampling provides decision-makers with science-based guidance to drive climate action and increase accountability.
Credit: Environmental Defense Fund
MethaneSAT was developed by the EDF, a longstanding organisation with a successful record of working with businesses and policymakers to solve critical environmental challenges. Rocket Lab operates the Mission Operations Control Center (MOCC) in Auckland, New Zealand. New Zealand’s MBIE (Ministry of Business Innovation & Employment) supports the mission, their first government-funded space mission.
Rocket Lab will manage mission operations for the first year and train New Zealand's future space professionals.
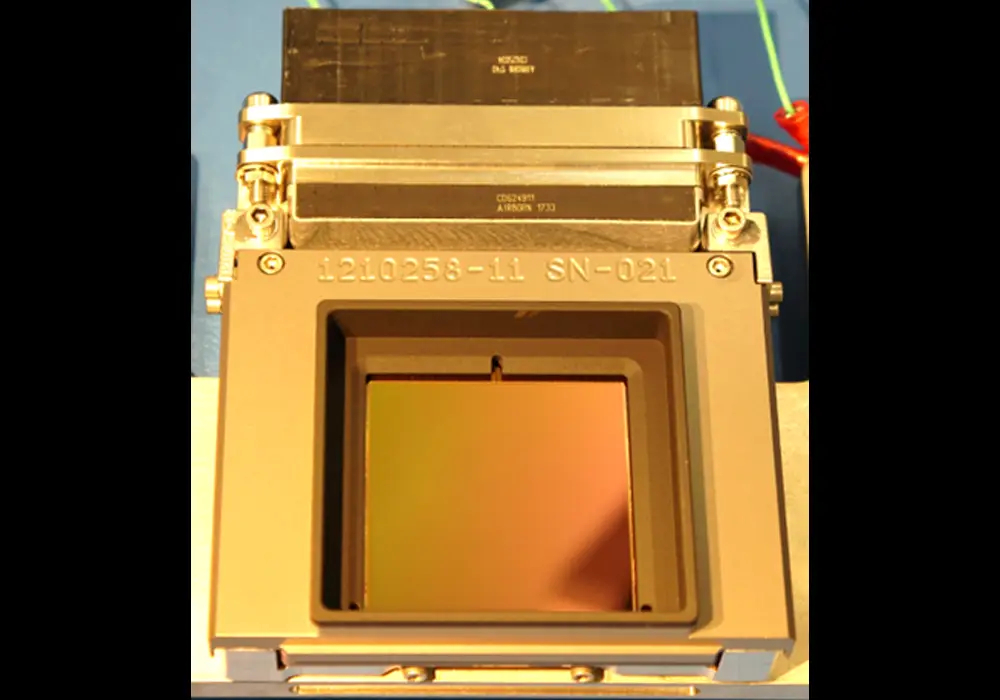
The GeoSnap-18 FPA produce by Teledyne Space Imaging. Credit Teledyne
MethaneSAT is an area-source detector that measures sunlight reflected off the Earth’s surface with two infrared Littrow spectrometers. Each instrument features a GeoSnap-18, 2048×2048 (2K×2K), HgCdTe focal plane array (FPA) produced by Teledyne Imaging Sensors. The FPAs were delivered to Ball Aerospace–now BAE Systems–which built the spectrometers.
Optimised for maximum coverage with the greatest detail, MethaneSAT’s spectrometers achieve a wide field of view with a 260km swath–each target area measuring 200 x 200 km (125 x 125 mi), a precision of 0.24 – 0.5%, and high spatial resolution of 100×400 m2. It measures O2 in the 1.249-1.305 µm band and methane and oxygen in the 1.598-1.683 µm band.
Unlike global mapping detectors, which measure large-scale methane trends with less detail, or point-source detectors, which focus on specific high-emission sites, MethaneSAT captures broad regions while still identifying smaller, diffuse sources of methane emissions. This capability allows the mission to provide a more comprehensive view of methane emissions than the other systems alone. In coordination with other instruments–like ISS’s EMIT–it provides weekly data from numerous target regions to quantify emissions from large point sources and smaller, widespread sources.
MethaneSAT is highly sensitive and can detect atmospheric gas concentrations as small as three parts per billion–exceeding the capabilities of contemporary satellites. Advanced analytics calculate the rate of emissions based on gas density, winds, and atmospheric conditions. A faster processing speed reduces computational time from months to days, ensuring that emission rate data updates frequently to provide actionable information.
Explore a full breakdown of global emissions on the MethaneSAT webpage.
Credit: Carbon Mapper
Carbon Mapper Tanager-1 targets high-priority emitting areas, emphasising infrastructure, including oil and gas fields, pipelines, refineries, power plants, natural gas systems, large livestock concentrations, wastewater plants, and landfills. Carbon Mapper aims to detect and track up to 90% of high-emission sources globally with near-daily frequency.
The only scientific instrument on Carbon Mapper is an imaging spectrometer that simultaneously measures 420 spectral channels of light. Ranging across 400 - 2500 nm, the broad spectrum allows scientists to observe many surface features, from gas emissions to ground chemicals to plant species.
With a high spatial resolution of 30 metres, Carbon Mapper can pinpoint and quantify emissions from individual facilities, including specific pieces of equipment–pipelines, flares, etc.–emitting 70-100 kg/hr of methane per hour and attribute emissions to within 30-50 meters. Additionally, the high sampling frequency and wide range, covering 130,000 km2/day, improves the detection of intermittent sources. This granular level of detail can help operators find and fix leaks quickly, diagnose root causes for emissions events, inform solutions and verify reductions.
This spectrometer technology is unique due to its high optical throughput, spatial and spectral uniformity, stability and low-noise. These instruments are optically “fast” and have a relatively large aperture opening over 30cm.
In addition to methane, Carbon Mapper tracks emissions of another prominent carbon molecule–carbon dioxide. Carbon Mapper has a detection limit of about 300,000 kgCO2/hr for a 5 m/s wind speed, sufficient to record emissions at 90% of the world’s coal power plants and many refineries and gas power plants.
As of February 2025, Carbon Mapper recorded more than 300 methane and carbon dioxide plumes derived from observations by the Tanager-1 satellite. This includes data on methane super-emitters from the oil and gas, coal, waste, and agriculture sectors across 25 countries on six continents.
On Oct. 9, Tanager-1 detected a large plume of methane, which Carbon Mapper traced to a gathering pipeline in the Texas Permian Basin. The team reported the leak to a state agency and the U.S. government, who subsequently notified the facility operator. The operator quickly responded and voluntarily conducted repairs, leading to meaningful emissions reduction. Follow-up observations from Tanager-1 detected no plume, confirming the leak was successfully fixed.
Data Availability
Both Carbon Mapper Tanager-1 and MethaneSAT will make methane data and insights publicly available for noncommercial use. That enables regulators, investors, and the public to see and compare emission totals by company, country or production basin. Officials and operators worldwide can find and fix problems faster, while stakeholders can see and compare progress against goals, commitments, and legal obligations.
Organisations such as the International Energy Agency and the International Methane Emissions Observatory created by the UN Environment Programme have indicated plans to use MethaneSAT and other satellite data to produce global integrated data products and analyses. The U.S. EPA, the European Commission, and several other U.S. states plan to utilise the data as it becomes available.
Works Cited:
Carbon Mapper. (2024, November 15) Carbon Mapper data from the Tanager-1 satellite reveals methane and carbon dioxide super-emitter activity around the world. https://Carbon Mapper.org/articles/carbon-mapper-data-from-tanager1-satellite-reveals-methane-and-co2-super-emitters
Ibid. (2024, September 24). First Light Images Released From the Carbon Mapper Coalition Tanager-1 Satellite. https://Carbon Mapper.org/articles/first-light-images-released-from-the-carbon-mapper-coalition-tanager-1-satellite
Ibid. (2025, February 05) New methane data from Tanager-1 satellite added to Carbon Mapper's portal. https://www.prnewswire.com/news-releases/carbon-mapper-achieves-first-tanager-1-methane-mitigation-success-302307601.html?tc=eml_cleartime
Ibid. New methane data from Tanager-1 satellite added to Carbon Mapper's portal. https://Carbon Mapper.org/articles/new-tanager-1-methane-data
Environmental Defense Fund. (n.d.). Permian Methane Analysis Project. https://www.permianmap.org/
Ibid. How MethaneSAT will hold polluters accountable. https://www.edf.org/MethaneSAT/data-holds-polluters-accountable
eoPortal. (2024, September 22). Carbon Mapper Mission. https://www.eoportal.org/satellite-missions/carbon-mapper
Ibid. (2024, August 16). MethaneSAT. https://www.eoportal.org/satellite-missions/methane-sat
Hamburg, S., & Duren, R. (2024, June 25). Two New Satellite Programs Join the Climate Fight. MethaneSAT. https://www.MethaneSAT.org/project-updates/two-new-satellite-programs-join-climate-fight
IEA. (2024). Global Methane Tracker 2024. IEA, Paris. https://www.iea.org/reports/global-methane-tracker-2024, Licence: CC BY 4.0
Khurana, M., & Tabuchi, H. (2024, March 3). Tracking an Invisible Climate Menace From 360 Miles Above. The New York Times. https://www.nytimes.com/interactive/2024/03/03/climate/methane-satellite-launch-global-warming.html
Ramón A. Alvarez et al., Assessment of methane emissions from the U.S. oil and gas supply chain.Science361,186-188(2018).DOI:10.1126/science.aar7204

