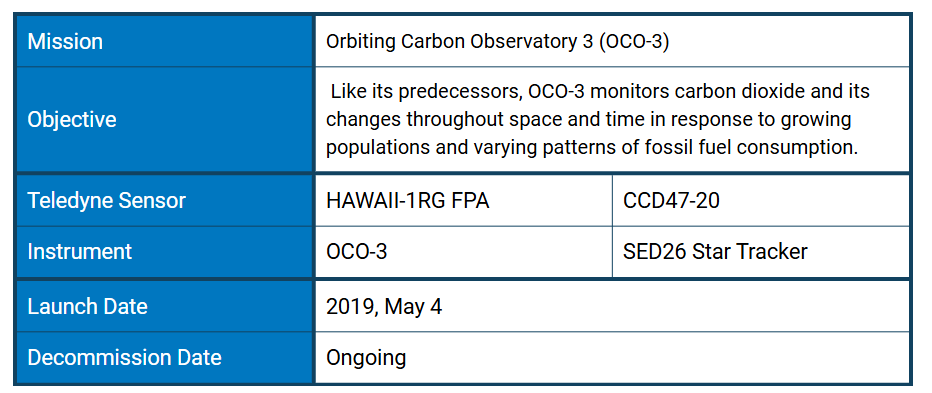
It is hard to exaggerate the profound impacts of global warming. Increases in atmospheric carbon dioxide (CO₂)—both manmade and natural—are responsible for two-thirds of the total energy imbalance that is causing Earth's temperature to rise.
Historically, the absorption of CO₂ by carbon sinks—oceans, forests, and wetlands—have offset half of the CO₂ produced by human activity: fossil fuel combustion, industrial manufacturing, land development, etc. These anthropogenic changes have created a large imbalance in the Earth's carbon cycle and advanced research conducted with refined instruments has revealed the immense stress the system is undergoing. CO₂ levels are now 150% the value they were at in 1750 —at least 1.5 times greater than the natural increase observed at the end of the last ice age 20,000 years ago, which occurred over thousands of years.
As a result, natural sinks are not doing enough to counter anthropogenic CO₂ sources. Successfully adapting to these shifting environmental conditions relies on accurately predicting the effects of climate change. Researchers need to understand where, when and how much CO₂ is released and removed from our atmosphere, and how the relevant processes will evolve. The Orbiting Carbon Observatory 3 (OCO-3), onboard the International Space Station (ISS), is investigating these important questions. Part of NASA's Earth System Science Pathfinder Project (ESSP), OCO-3 gathers precise, time-dependent global measurements of atmospheric CO₂ as well as solar-induced chlorophyll fluorescence (SIF), a direct proxy for plant photosynthetic activity that is used to calculate carbon absorption and study vegetative stress.
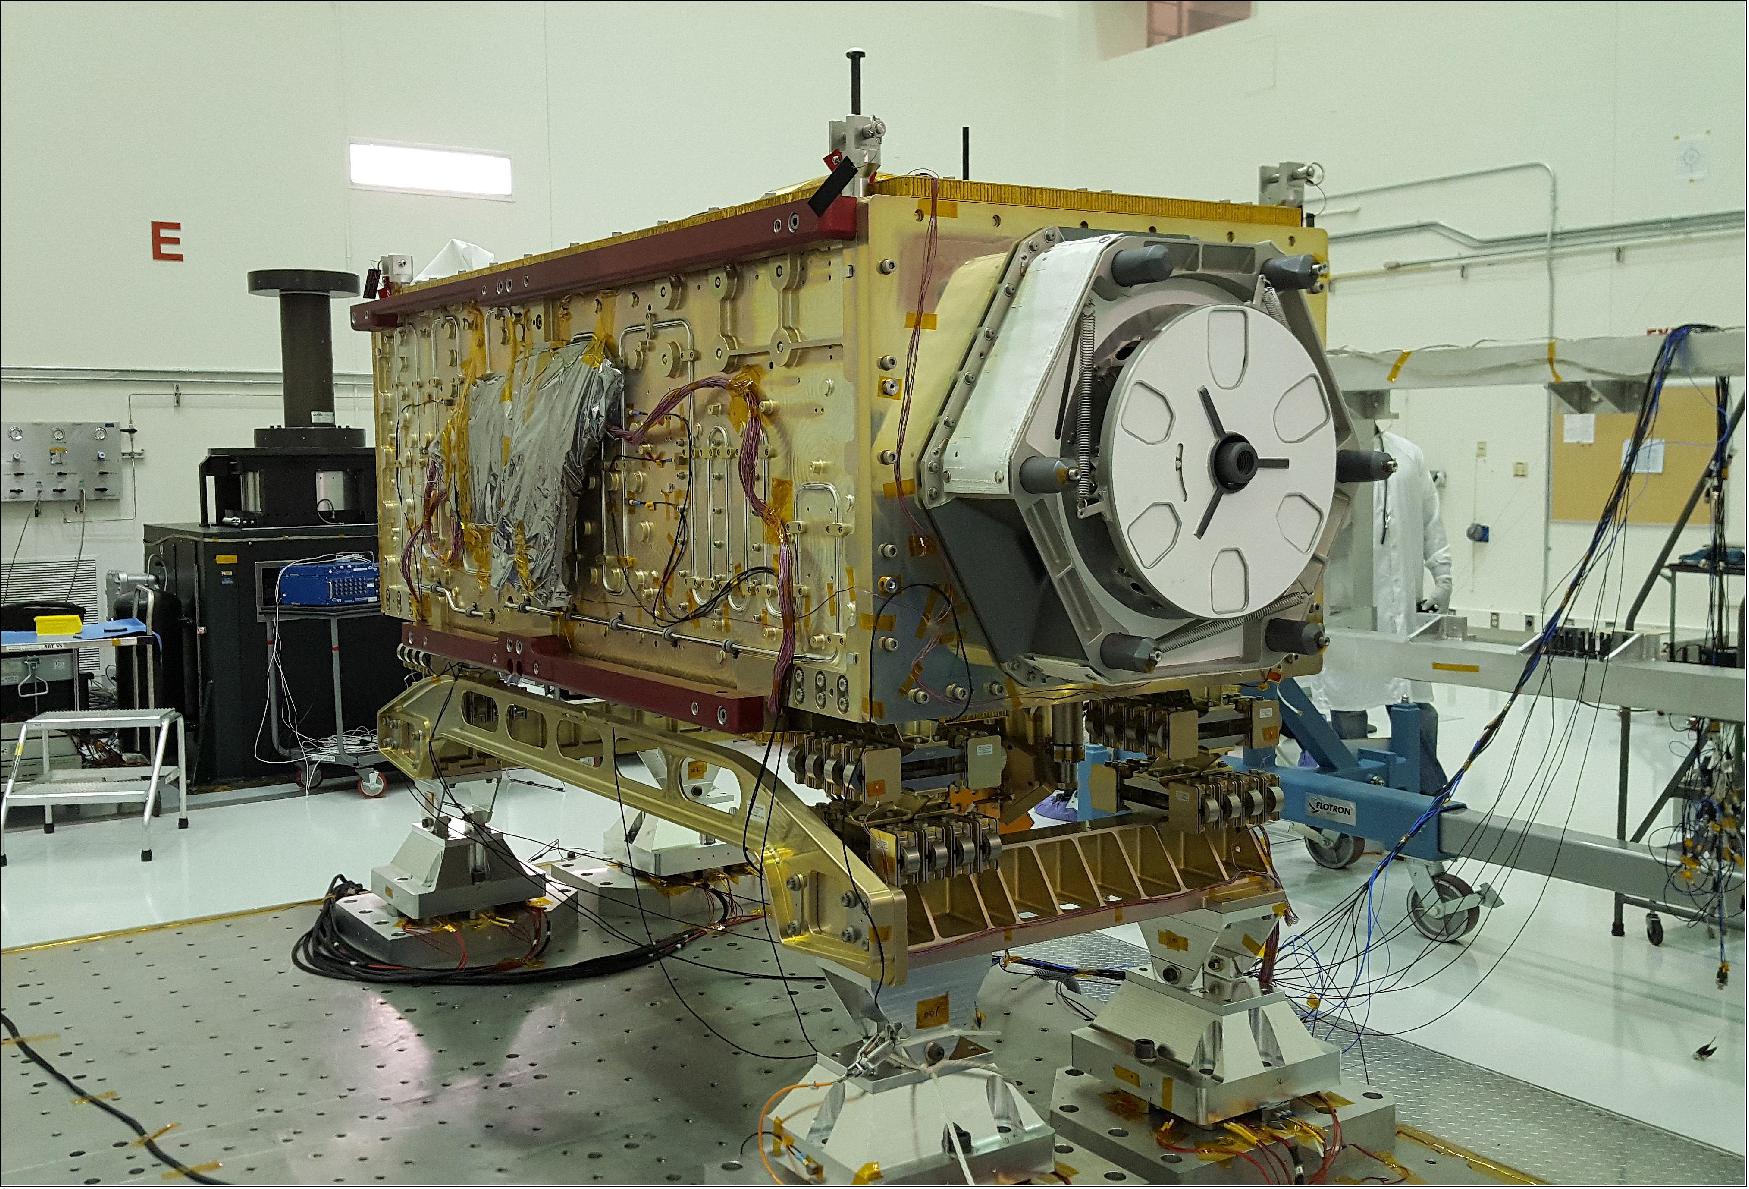
OCO-3 sits on the large vibration table (known as the "shaker") in the Environmental Test Lab at NASA's Jet Propulsion Laboratory. The exposed wires lead to sensors used during dynamics and thermal-vacuum testing. Credit: NASA/JPL-Caltech
OCO-3 continues the Earth observation legacy of the OCO programme, and joins other ISS instruments such ECOSTRESS, and EMIT. With data from TROPOMI— flying on Sentinel 5P —this collection of instruments creates synergies for optimizing agricultural production and carbon storage, and for quantifying impacts of urban activities across multiple scales. The raw environmental data collected by OCO-3 has been translated into actionable climate information to help communities shape urban development, understand patterns of fossil fuel combustion, and better manage their resources to increase food security and their resilience to future hazards.
Installed in 2019 on the Exposed Facility of Japan's Kibō Experiment Module, OCO-3 follows the low Earth orbit of the ISS. It scans 85% of the Earth’s surface, covering 95% of the world’s populated landmass every 1-3 days. OCO-3 maps changes throughout the day as the station’s orbit carries it over a given location earlier on each orbital track, spanning all sunlit hours within a month. This diurnal sampling allows scientists a new ability to track daily variations in the release and uptake of carbon dioxide, and the cycle of both clouds and aerosols. Additionally, OCO-3's SIF measurements provide a unique record of hour-to-hour variations in plant health with respect to studying the biosphere response—both natural and anthropogenic—to changes in sunlight.
The OCO-3 Spectrometer
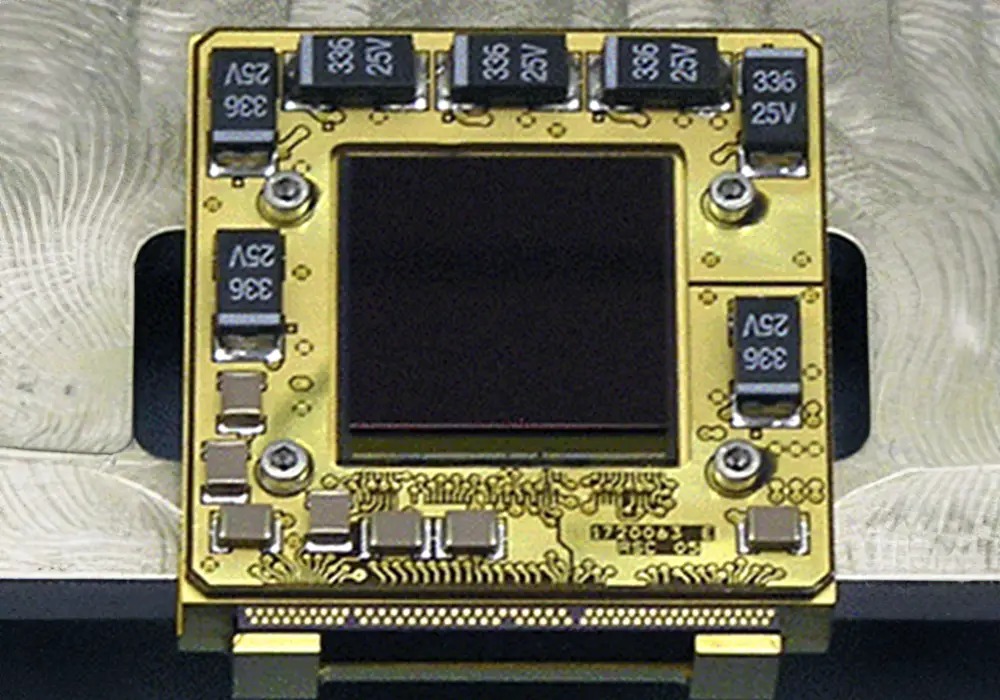
Teledyne’s visible and infrared H1RG focal plane arrays (one shown above) enable the Orbiting Carbon Observatory-2 (OCO-2) to make precise measurements of CO₂ in the Earth’s atmosphere. Credit: Teledyne
OCO-3 was built by adapting a duplicate version of OCO-2, originally built as a "flight spare" —an exact copy that a mission builds in case there's a problem with the original instrument.
The instrument consists of three high-resolution and co-aligned grating spectrometers designed to measure near-infrared absorption by CO₂ and molecular oxygen (O₂) in reflected sunlight. Carbon dioxide and oxygen absorb light at different wavelengths. OCO-3 does not observe CO₂ directly. Rather, it records the intensity of the sunlight reflected from the presence of CO₂ in a column of air. This measurement is unique like a fingerprint, and can be used for identification. The CO₂ to O₂ ratio is used to determine the concentration of atmospheric CO₂, which averages 405 ppm. OCO-3 measures this tiny percentage with 0.3 percent accuracy equating to less than 1 ppm.
Each spectrometer measures light in one specific region of the spectrum: O₂ A-band at 0.76 µm, and CO₂ bands at 1.61 and 2.06 µm. The spectrometer optics produce a 2-dimensional image of the spectra on a 1024×1024 (18 µm pitch) pixel focal plane array (FPA). As with OCO-2, all three of the FPAs used by OCO-3 are Teledyne’s proven HAWAII-1RG detectors. The focal plane array in the O₂ channel uses a silicon light detecting material, while the CO₂ channels use mercury cadmium telluride (HgCdTe) light detecting material with a 2.5 µm cutoff wavelength. OCO-3 observes over a swath area of 4.5 km² (2.8 mi²) with a spatial resolution of 2.25 km (1.5 mi) down-track by 0.7 km (.4 mi) cross-track).
OCO-3 uses a diffraction grating—like the back of a compact disk—to separate the incoming sunlight into a wide spectrum of multiple component colors. It incorporates 17,500 different colors to cover the entire wavelength range that can be seen by the human eye. A digital camera covers the same wavelength range using just three colors.
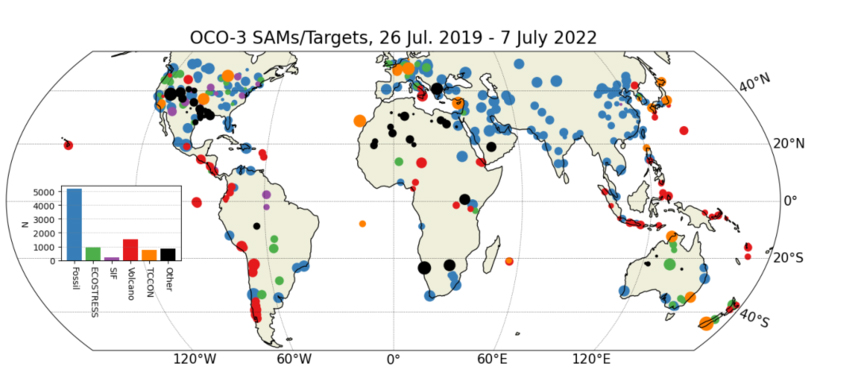
Map of all OCO-3 SAMs and Targets recorded through July 2022, categorized by site type. Credit: Scientific Figure on ResearchGate. Available from: https://www.researchgate.net/figure/Map-of-all-OCO-3-SAMs-and-Targets-recorded-through-July-2022-categorized-by-site-type_fig2_362963885
A major innovation over OCO-2 is the addition of an agile 2-D pointing mirror assembly (PMA). Where OCO-2 relied on maneuvering the satellite bus itself, the flexible PMA system uses two pairs of mirrors to rapidly point to new locations— observing up to 40 locations a day. The PMA will also allow for target-mode observations, including the Total Column Carbon Observation Network (TCCON) ground sites for use in validation. Target-mode has also been used to capture "snapshots" to map local differences in CO₂ from space for the first time. These snapshots are detailed mini-maps covering an area of about 80 x 80 km (50 x 50 mi) within minutes. This snapshot mapping mode can measure emissions from sources ranging from relatively small areas surrounding power plants to large urban areas up to 2,590 km² (1,000 mi²).
The nominal planned viewing strategy of OCO-3 is to take down-looking nadir-viewing measurements over land to minimize the probability of cloud and aerosol contamination. Over water, measurements are taken near the specular reflection spot—glint viewing—to maximize the signal over the low-reflectivity surface. The PMA allows for transitions between the nadir and glint mode of the order of tens of seconds.
Monitoring Plant and Crop Health
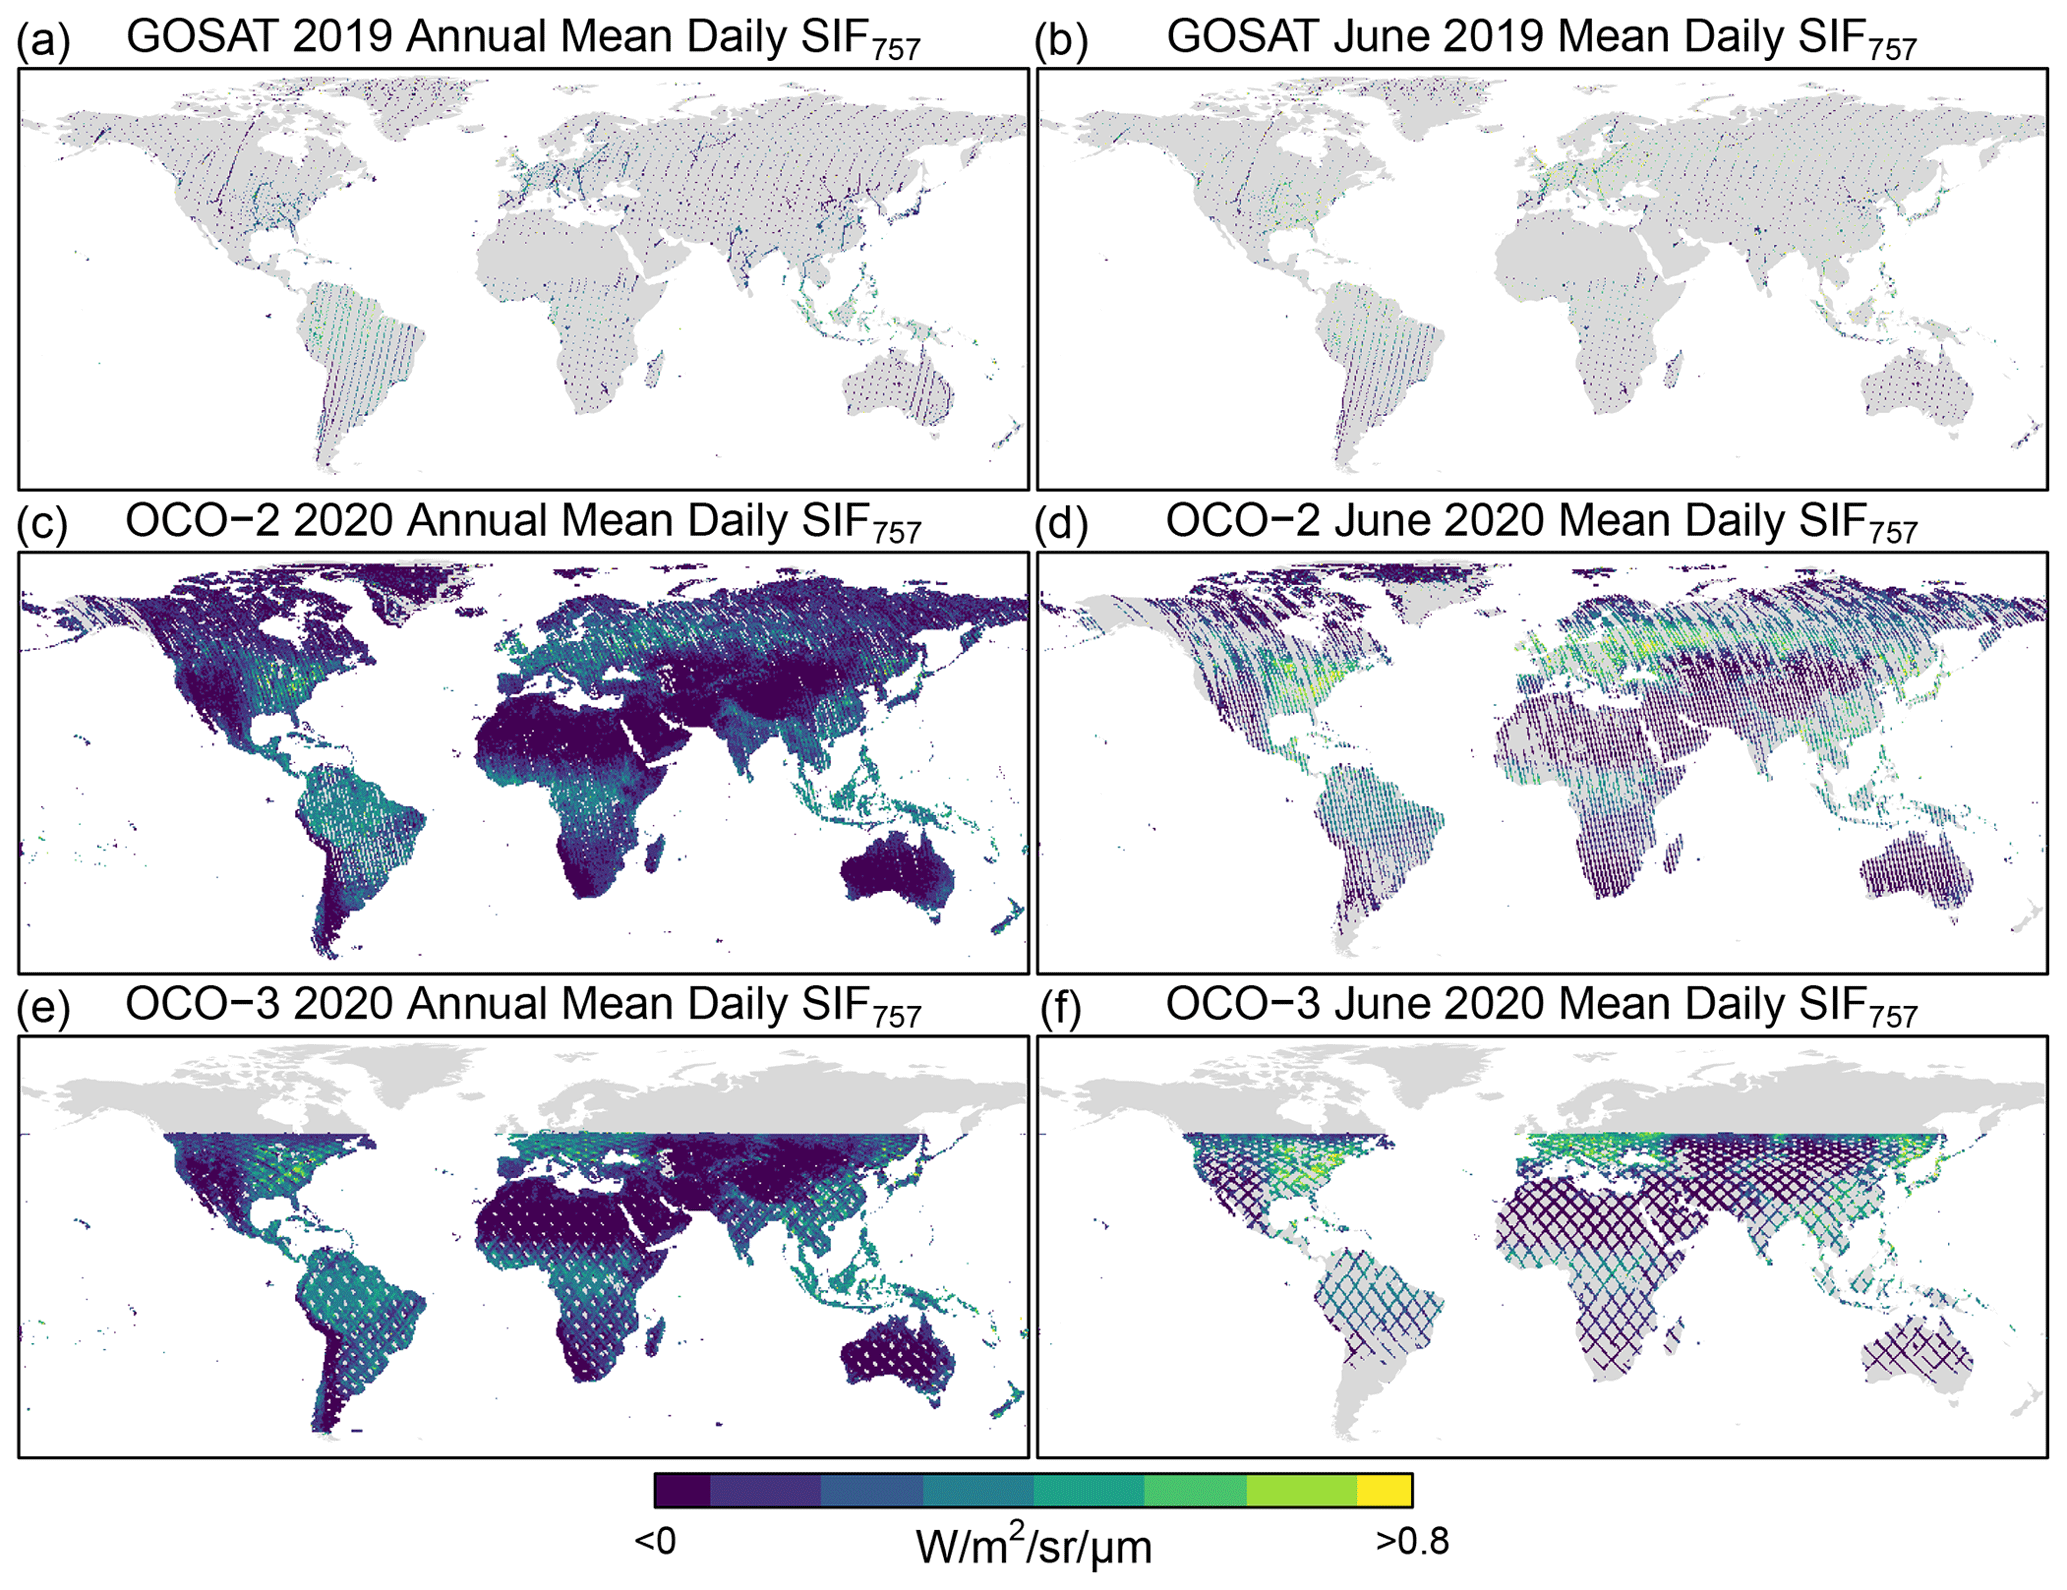
Annual (2020) and June 2020 mean daily SIF757 for GOSAT, OCO-2, and OCO-3. The annual and monthly nadir-mode coverage of GOSAT, OCO-2, and OCO-3 is presented here as the mean daily SIF at 757 nm at a gridded resolution of 0.5∘ for visualization. Included are soundings from all measurement modes flagged as best and good quality and clear of clouds. At nadir, the diameter of the GOSAT soundings is ∼10 km (6.2 mi), and the widths of the OCO-2 and OCO-3 swaths are about 10 and 13 km (6.3 and 8 mi), respectively. Thus, the data gaps shown here are larger than depicted and are not to scale. Credit: Doughty, R., et al.
When plants absorb more sunlight than they need to power photosynthesis, they release the excess solar energy which appears as a very faint glow. Though far too dim to notice under normal circumstances, it can be measured with an IR spectrometer. Called solar-induced fluorescence (SIF), it's the most accurate signal of photosynthesis that can be observed from space. SIF can dim or brighten as temperature, water, and sunlight become more or less favorable for growth. Capturing rapid changes in how plants absorb and use light, SIF data is invaluable for tracking vegetation health, productivity, and rate of carbon sequestration.
OCO-3 also records time-of-day variations that can inform projections of changes in the global carbon cycle in response to long-term changes in factors such as temperature and water availability in the Earth system. As Earth's climate changes, rainfall and temperature are changing plant growth around the globe in ways that may affect world food security. Understanding exactly when photosynthesis happens—how its seasonal startup and shutdown are changing in remote locations around the globe—can help us prepare for the challenges of the future.
Interestingly, the ability for OCO to record SIF was a surprising and fortuitous discovery. When the OCO programme started with OCO-2, the instrument was designed to measure CO₂ in the atmosphere. Thus, it used Fraunhofer lines—narrow wavelengths of light that never leave the Sun’s photosphere—as a reference point. Accordingly, the Fraunhofer lines should not have any light in them, but upon examination, the lines contained light. Since the Sun doesn't emit that wavelength of light, scientists determined that the glow is coming from plants, as fluorescence. The O₂ spectrometer records not only wavelengths absorbed by O₂, but also nearby wavelengths where SIF shines particularly strongly.
As SIF is a measurement of how much plants are photosynthesizing, it can indicate areas of drought weeks or months before plants show any outward signs of stress, such as discoloration. This can help agricultural areas to prepare and try to offset the effects of a drought far earlier. Additionally, OCO-3 data helps optimise irrigation strategies for crops, and provides timely and accurate estimation of crop yields, offering the promise of aiding in effective responses to food crises, informing agricultural policies, and efficient commodity pricing.
As Earth's climate changes, growing seasons worldwide are changing in both timing and length. Agricultural vulnerability to drought and extreme weather is also increasing. These changes may affect world food production and the pace of greenhouse warming. It's not possible to measure photosynthesis globally from ground level, and lab experiments can't easily replicate all of the environmental factors affecting plant growth, such as water availability, wildfires and competition from other plants—factors that also are changing with the climate.
CO₂ Monitoring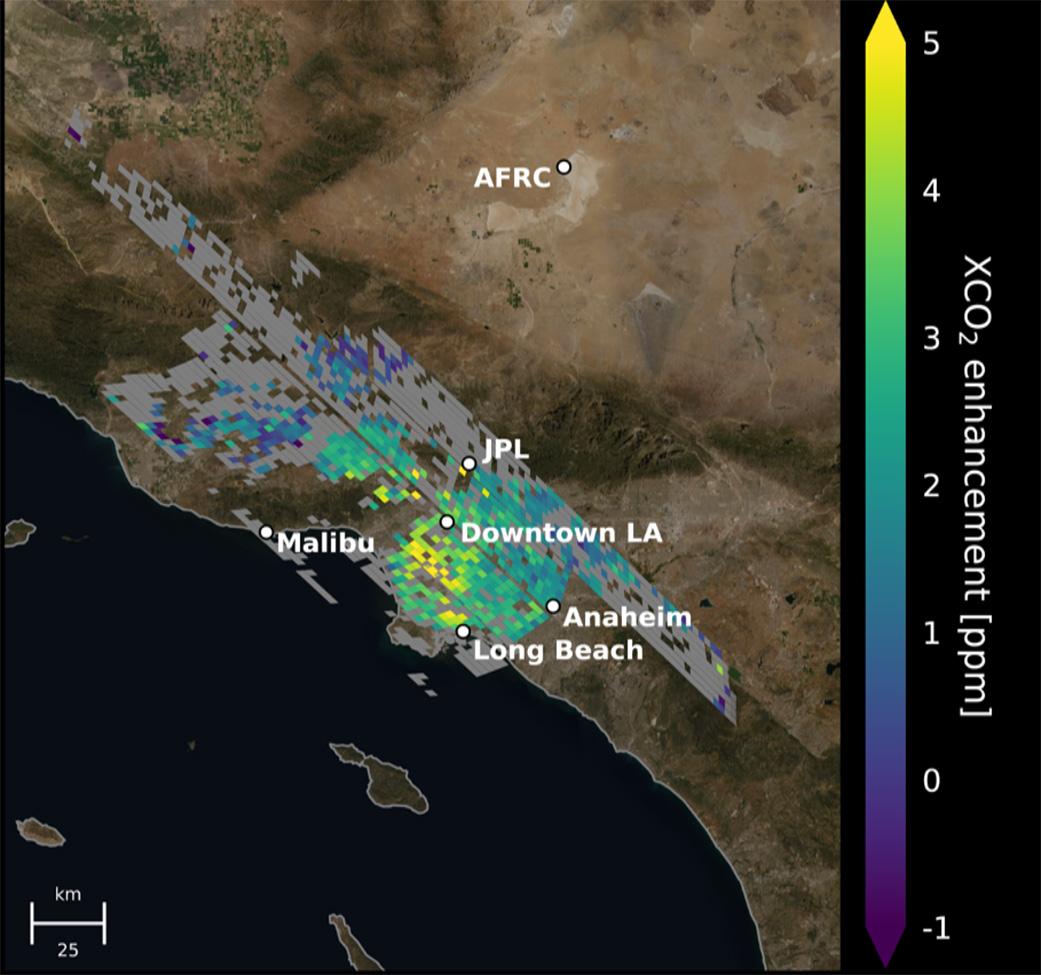
Map of CO₂ concentrations around the Los Angeles metropolitan area. Each pixel is about 2.2 km (1.3 mi); the color indicates how much higher the concentration of CO₂ is in that spot than in clean desert air north of the city (measured at NASA's Armstrong Research Center, upper right). The highest CO₂ readings, in yellow on the map, are on the west side of downtown L.A. – a densely populated area with congested freeways and CO₂-emitting industries. Yellow indicates atmospheric CO₂ elevated by five or more molecules out of every million molecules of air, or five parts per million. That's equivalent to the amount that global atmospheric CO₂ is rising globally on average every two years. Credit: NASA/JPL-Caltech
The origins of carbon dioxide can be hard to discern by satellite because the gas mixes rapidly and uniformly into the air. OCO-3 measures the column averaged atmospheric carbon dioxide (CO₂) dry air mole fraction—i.e. XCO₂. CO₂ observing satellites cannot observe green house gasses directly, but instead average the entire atmospheric column of CO₂. Rather than taking a single observation at the surface, an integration of atmospheric CO₂ above a specific location is observed. The 'X' refers to the observation taking place from a satellite platform.
To differentiate between a city's own output and CO₂ that drifted into the city on air currents, OCO-3 supports an accuracy better than 1 part per million (ppm). This enables scientists to characterise and monitor the geographic distribution of surface CO₂ sources, including plant and animal decay, deforestation, wildfires, and volcanoes. OCO-3 also provides very high resolution to target point sources like power plants and cities.
Measuring large urban areas is particularly important to scientists since about 70% of total fossil-fuel emissions come from those areas. Before the OCO programme, estimates of CO₂ emissions often relied on tracking fuel sales and making assumptions on where those fuels are burned. OCO-3 data was used to measure “top-down” estimate CO₂ emissions for 54 global cities including Tokyo, LA, the South African Highveld region, Buenos Aires, Melbourne, and Mexico City. While data from OCO estimates match fuel-usage-based data sets within 7% globally, there are regional differences in cities in North America, Europe, Asia, and Africa. Socioeconomic analysis revealed that high-income cities tend to have less carbon-intensive economies: North American cities emit 0.1 kg (.2 lb) CO₂ per USD of economic output, while African cities emit 0.5 kg (1.1 lb) CO₂ per USD. Additionally, larger cities produce less CO₂ per person—cities under 5 million people emit 7.7 tons per person, whereas cities over 20 million emit just 1.8 tons per person.
A year long study focusing on the “Los Angeles megacity” found that urban greenery— decaying trees, lawns, and other vegetation—accounts for about one-fifth of the excess carbon dioxide observed in the air over the study area. This was more than researchers anticipated and underscores the complexity of tracking urban carbon emissions. One way scientists can differentiate sources of CO₂ is through the detection of carbon-14—a rare form of carbon that occurs naturally in Earth’s atmosphere and is absorbed by living things as they grow. This is the same element that enables radiocarbon dating. The carbon found in coal, oil, and natural gas is hundreds of millions of years old so all of its carbon-14 decayed long ago. This means that CO₂ containing traces of carbon-14 were produced by decomposing organic matter, not through fossil fuel combustion.
Cities are another area where the SIF measurement is of interest. They are hotter than surrounding natural regions because of their many heat sources and heat-absorbing surfaces, like pavement. Comparing how the same species of plants grow and thrive in both a city and its natural surroundings gives a sort of sneak preview of how the these plants will respond to a warmer climate.
Conclusion
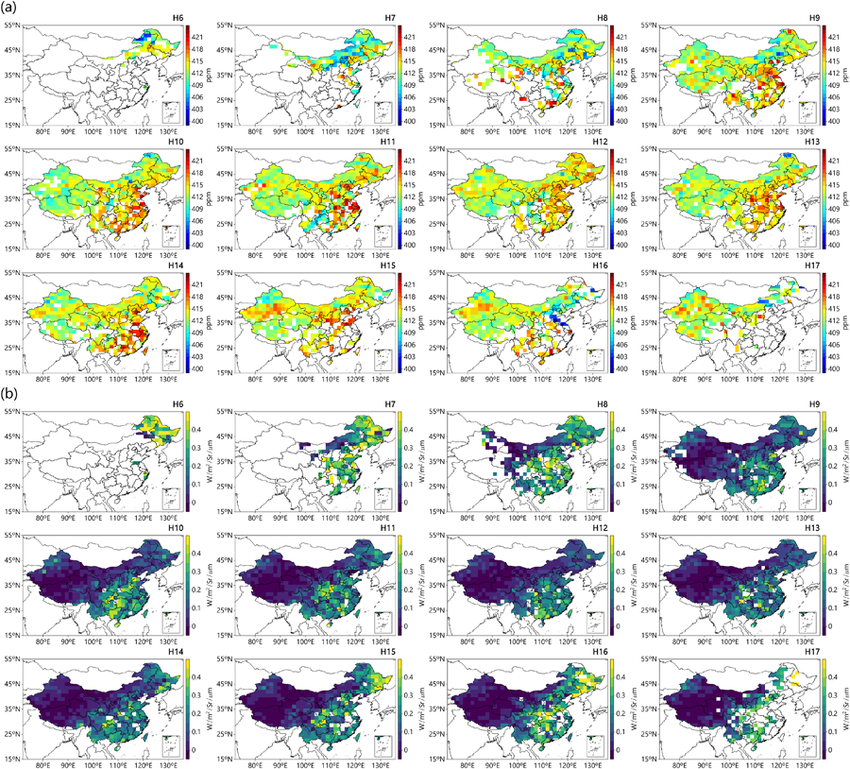 Spatial distributions of diurnal average XCO₂ and SIF from OCO‐3 aggregated into a 1.5° × 1.5° grid in daytime (06:00–17:00 CST) over China during 2020–2021. Credit: Zhao, Hengheng, et al.
The OCO programme continues to produce and refine the most detailed picture of human and plant influences on the carbon cycle specifically, and climate in general. Targeted, high-resolution measurements over multiple cities and point sources investigate economic activity and infrastructure investments. Tracking emissions from space improves emission tracking, making global monitoring more accurate and transparent. These insights can help cities better track and eventually reduce their CO₂ emissions. Additional benefits include rapid estimation of crop yield, timber volume, and livestock production at risk to abiotic and biotic stressors, wildfires, and extreme weather.
OCO-3 data is also improving climate models—resolving the largest source of uncertainly: land uptake of CO₂. Now this data can be used to more accurately quantify exchanges between the atmosphere and land. Upcoming climate focused missions like GOSAT-GW will continue to reveal how the complicated carbon cycle operates.
Works cited:
Ahn, D. Y., Goldberg, D. L., Liu, F., Anderson, D. C., Coombes, T., Loughner, C. P., et al. (2025). Satellite-based analysis of CO₂ emissions from global cities: Regional, economic, and demographic attributes. AGU Advances, 6, e2025AV001747. https://doi.org/10.1029/2025AV001747
Bell, Emily & Taylor, Thomas & Merrelli, Aronne & O'Dell, Christopher & Nelson, Robert & Kiel, Matthäus & Eldering, Annmarie & Rosenberg, Robert & Fisher, Bonnie. (2022). Exploring bias in OCO-3 Snapshot Area Mapping mode via geometry, surface, and aerosol effects. https://doi.org/10.5194/amt-2022-241
Eldering, Annmarie; Taylor, Tommy E.; O'Dell, Chris W.; Pavlick, Ryan (2018). "The OCO-3 mission; measurement objectives and expected performance based on one year of simulated data". Atmospheric Measurement Techniques Discussions: 1–54. https://doi.org/10.5194/amt-2018-357
eoPortal. (2019, April 5). ISS: OCO-3 (Orbiting Carbon Observatory-3). https://www.eoportal.org/satellite-missions/iss-oco-3
Liu, Y., Peñuelas, J., Cescatti, A., Zhang, Y., & Zhang, Z. (2024). Atmospheric dryness dominates afternoon depression of global terrestrial photosynthesis. Geophysical Research Letters, 51, e2024GL110954. https://doi.org/10.1029/2024GL110954
NASA EarthData. (nd.). OCO-3 Spectrometer. https://www.earthdata.nasa.gov/data/instruments/oco-3-spectrometer
NASA. (2020, November 13). Study: Decaying Urban Greenery Plays a Surprising Role in Carbon Emissions. https://www.nasa.gov/centers-and-facilities/jpl/study-decaying-urban-greenery-plays-a-surprising-role-in-carbon-emissions/
NASA. (2026, August). Carbon Dioxide - Earth Indicator. https://science.nasa.gov/earth/explore/earth-indicators/carbon-dioxide/
NASA. (2019, April 2). More Than a Carbon Copy: OCO-3 on the Space Station. https://www.nasa.gov/missions/station/iss-research/oco-3/more-than-a-carbon-copy-oco-3-on-the-space-station/
NASA JPL. (2021, June 7). NASA Map Gives Most Accurate Space-Based View of LA’s Carbon Dioxide. https://www.jpl.nasa.gov/news/nasa-map-gives-most-accurate-space-based-view-of-las-carbon-dioxide/?utm_source=iContact&utm_medium=email&utm_campaign=nasajpl&utm_content=Copy+of+earth20210607-1
Svoboda, M., Kira, O., Sun, Y., Smith, W. K., Magney, T., Wood, J. D., & Parazoo, N. C. (2025). Monitoring the pulse of America's natural resources from the Orbiting Carbon Observatory missions. AGU Advances, 6, e2025AV002063. https://doi.org/10.1029/2025AV002063
Zhao, Hengheng & Gui, Ke & Yao, Wenrui & Shang, Nanxuan & Zhang, Xutao & Zhang, Xinglu & Li, Lei & Zheng, Yu & Wang, Zhili & Ren, Hongli & Wang, Hong & Sun, Junying & Li, Jian & CHE, Huizheng & Zhang, Xiaoye. (2023). Seasonal and Diurnal Variations in XCO₂ Characteristics in China as Observed by OCO‐2/3 Satellites: Effects of Land Cover and Local Meteorology. Journal of Geophysical Research: Atmospheres. 128. https://doi.org/10.1029/2023JD038841

