Global warming has prioritised understanding the interaction of solar radiation with Earth's atmosphere, and predicting how surface changes on the Sun affect the overall solar output. Solar radiant energy is one of the major driving inputs for terrestrial climate, but the total amount of energy the Earth receives from the Sun is not consistent. The Sun cycles through periods of higher and lower activity causing small changes in energy production with significant consequence. Historical data shows how a minuscule change in the solar energy received by the Earth -- such as a 0.5% difference spread over more than a century -- can trigger substantial climatological changes. Differentiating anthropomorphic and natural climate warming enables researchers to reconstruct the history and chart the current path of Earth's environment.
Some of the earliest heliophysics data was collected by French astronomer Jean Picard who calculated the first accurate measurements of the solar diameter and rotational velocity in the 17th century. Measurements of the solar diameter collected over the past three centuries, have found ongoing variation seemingly independent of differences in solar activity such as lumosity or solar flare frequency. Of note, Picard's measurements were taken during the Maunder minimum: a period of regional cooling with no sunspot detected from 1650 to 1715. Also known as the Little Ice Age, regressive analysis reveals that the Sun was slightly larger than today. This counterintuitive phenomena highlights the importance of a definitive determination of the Sun's size. As the data had been observed from ground, atmospheric disturbance was thought to be the cause of any inconsistencies. Observation from space would avoid such interference while presenting an important set of technical challenges -- the very few observations taken outside the atmosphere show variation from 30 to 400 milliarcseconds (mas).
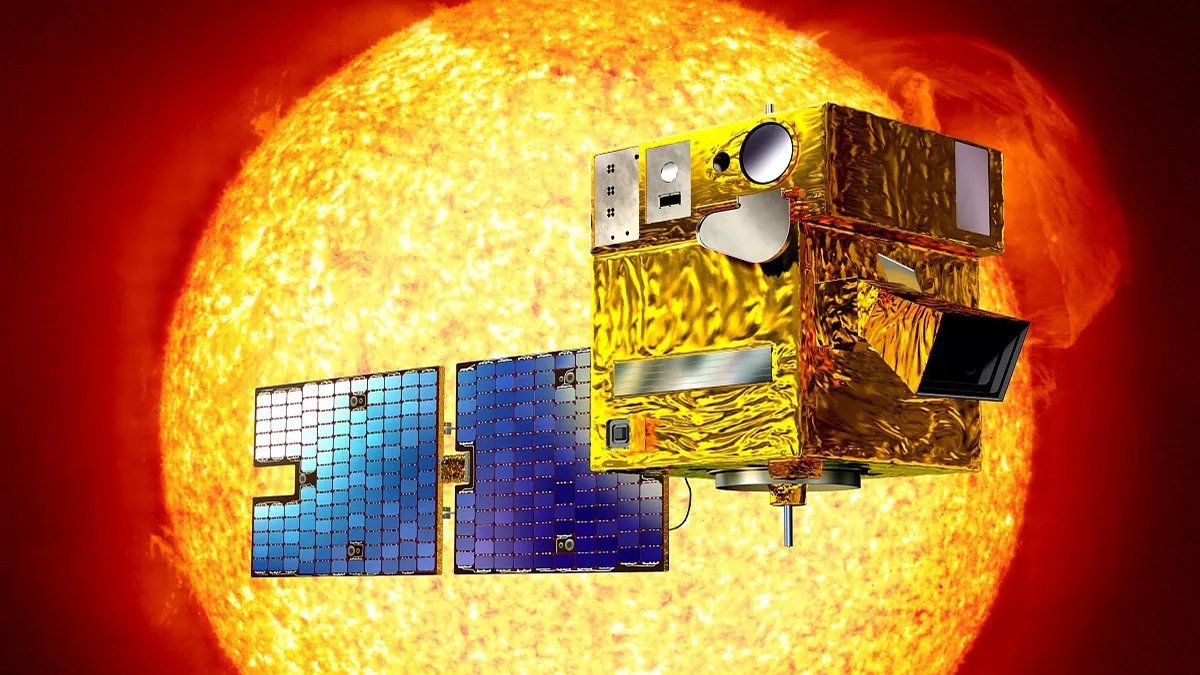 Credit: CNES/ill./DUCROS David, 2008
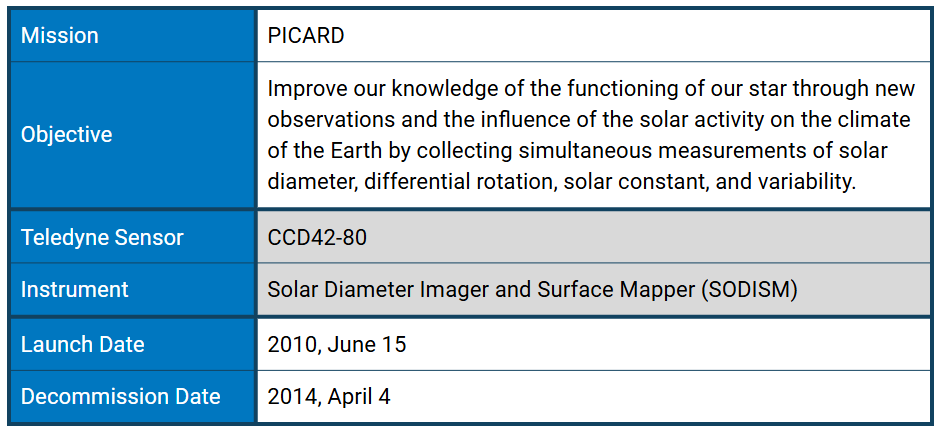
Named after the astronomer and launched in 2010, PICARD was a CNES mission of the Myriade microsatellite series that collected absolute measurements used to validate models of solar mechanics to help understand how our Sun functions. Changes in the Sun are caused by magnetic fields generated in the solar dynamo at the base of the convective zone which can create large convective cells, differential rotation, and plasma turbulence. Deployed in LEO, PICARD simultaneously measured an array of fundamental solar parameters to examine their long and short-term variability across time scales while also conducting helioseismology to probe the solar interior and surface features.
SOlar Diameter Imager and Surface Mapper (SODISM)
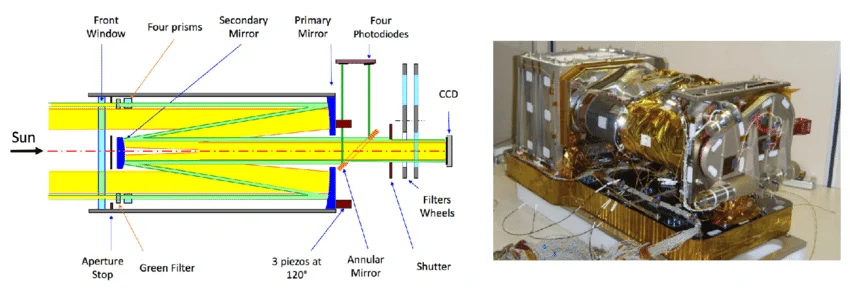
(left) PICARD/SODISM optical path. (right) The PICARD/SODISM instrument during integration. Credit: Mefta, M., et al.
The SODISM metrological instrument was an 11-cm diameter Ritchey-Chrietien telescope featuring a specialized Cassegrain reflector with multiple hyperbolic mirrors to obtain ultra-precise measurements of the Sun's diameter, shape, and rotation.
SODISM used a back thinned, anti-reflection coated, 2048 x 4096, 13.5 µm pixel CCD 42-80 produced by Teledyne. Operating in a frame transfer mode, the detector was split into two zones: a 2048 × 2048 image zone where the signal is accumulated during integration, and a 2048 × 2048 memory zone where the signal was stored during readout. Some areas of the CCD were also dedicated to dark current and scattered light measurements. Back-illumination improved sensitivity with a high quantum efficiency in the 370–950 nm spectral range.
Acurate measurements of the radiant ball of gas that is the Sun, relies on extreme image stability and pointing accuracy. SODISM achieved a pointing accuracy of 0.003 arcsec per image and a pointing knowledge of 0.001 arcsec, corresponding to 42 and 14 km (26 and 9 mi). It featured an FOV of 35 arcmin, an angular resolution of 1.06 arcsec, and a measurement precision of < 3 marcsec (mas) per image.
To calculcate the absolute angular reference, SODISM calibrated on angular distances of nine star doublets comparable to the Sun diameter, to achieve prepointing within a few degrees. These observations were made every three months by rotating the spacecraft toward each pair of stars. The proper motion of the calibration stars were also determined by measurements taken by other space missions such as \[GAIA](). The optical system responsible for image stabilization consisted of a series of four prisms that projected four auxiliary images in each corner of the CCD. A series of photodiodes provided a voltage output proportional to the received light intensity to perform micro adjustments so that the image of the Sun on the CCD did not move by more than 0.1 arcsec.
SODISM measured solar irradiation in four spectral bands and two calibration bands, using three cascading filter wheels to select four channels in the VIS range (535.7 to 782.2 nm), and two in UV at 215 and 393.37 nm (Ca II-K line). The Ca II K line is a prominent spectral line, which is split into three regions. Each region shows a specific area of the chromosphere revealing magnetic structures of the Sun. The Ca II K line is very sensitive to magnetic activity. It also corresponds to ozone bands which chemically react in the stratosphere to influence cloud formation.. However, it is very wide and complex, showing a profile both in absorption and in emission. SODISM's Ca II K filters had a wide bandwidth of 0.7 nm over the core at 393.37 nm, which covered the entire K1, K2, and K3 regions.
In addition to a microsatellite, the PICARD mission also collected observations from the ground. SODISM II was the SODISM qualification model that was installed at the Calern Observatory in France. It had the same specifications of the space instrument -- with the exception of a 1.025 um filter replacing the 215 nm. The PICARD ground segment allowed a comparison of diameters acquired in space and on the ground to understand the influence of the atmosphere on the solar diameter in order to identify possible biases and correct historical series.
Measuring Solar Energy; Total and Spectral Irradiance
The Sun emits energy that is absorbed or reflected by molecules in the terrestrial biosphere -- a complex system of clouds, aerosols, atmospheric constituents, oceans, ice and land surfaces. Elements such as ozone, water, carbon dioxide, and methane, each absorb their own set of characteristic wavelengths. The distribution of the Sun’s energy input across ultraviolet, visible, infrared, and other wavelengths of light is called solar spectral irradiance (SSI). Where this radiative energy is deposited into the different layers of the climate system will be determined by how the incoming solar radiation is distributed with wavelength, and how much variation occurs at each wavelength. So, it is important to know how the energy in each wavelength varies, since that tells us how the heating varies in different parts of Earth’s atmosphere.
The sun's total energy input reaching Earth is called total solar irradiance, or TSI. Variations in TSI are due to a balance between dimming caused by sunspots -- where very strong magnetic bands block the solar plasma -- and brightening caused by highly radiative areas called faculae which surround sunspots. Overall, the brightening effects of the faculae tend to outweigh those of the dark sunspots so less sunspot activity indicates decreased energy production. Faculae, the bright area the surface of the Sun, put out more radiation than other areas and increase the solar irradiance. They too are the result of magnetic storms, and their numbers increase and decrease in concert with sunspots. Overall, the effects of the faculae tend to outweigh those of the sunspots. Therefore the TSI is larger during the maximum of the 11 year cycle when there are more sunspots, even though the individual spots themselves cause a decrease in TSI when facing Earth.
SODISM measured the SSI while two absolute radiometers also on PICARD measured the TSI. This data informs the dynamics of Earth’s radiation budget: the balance between the incoming radiation from the Sun and the outgoing reflected and scattered solar radiation plus the thermal infrared emission to space.
Solar Radius Determination
Image of the Sun taken by SODISM instrument - raw image (left) and corrected image (right). Credit: Mefta, M., et al.
One of the PICARD objectives was to determine the absolute values of the solar radius at several wavelengths at 393.37, 535.7, 607.1, 782.2, and 1025.0 nm. The last four wavelengths were selected for their desired shortage of Fraunhofer absorption lines, while the 393.37 nm wavelength reflects the chromosphere and activity therein. Additionally, 160 nm and Lyman alpha filters aided in identification of active regions and prominences which can oversaturate pixels adding noise to diameter measurements.
A change in diameter would suggest a change in internal solar features likely in the convective zone where hot plasma rises and cooler plasma sinks in circulating cells. The solar atmosphere is primarily composed of the photosphere, the chromosphere, and the corona. The photosphere -- the lowest layer of the solar atmosphere -- is about 500 km (310 mi) thick and provides more than 90% of the solar emitted radiation -- particularly visible spectra. For a given solar atmosphere, the solar radius depends on wavelength. The SODISM evaluated the solar radius wavelength dependence in different wavelength intervals, separating the measurements between the various solar regions.
Given that the solar shape in the photospheric continuum is nearly perfectly circular, the images collected by SODISM provided 4000 diameter measurements registered at different positions within each pixel. Using this set of measurements, the pixellisation effect was averaged and the diameter was obtained with a precision of a few milliarc-seconds (mas). Collecting measurements during the 2012 Venus transit further increased the certainty of SODISM's calculations as the relative position of Venus and the Sun are known with very high accuracy.
SODISM's observations determined the absolute value of the photospheric and specific chromospheric solar radius. The first measurements obtained in August 2010 were found close to values as expected from theoretical modeling. In particular, the diameter at Ca II was found greater than at 535 nm -- in the photospheric continuum -- by about 400 mas as predicted. The PICARD space-based results as well as PICARD ground-based results showed that the solar radius wavelength dependence in the visible and the near-infrared is extremely weak. The differences in inflection point position of the solar radius at 607.1 nm, 782.2 nm, and 1025.0 nm from a reference at 535.7 nm are less than 60 km (37 mi) for the different PICARD measurements of solar radius:
* 535.7 nm = 696 134 ± 261 km (ξ)
* At 607.1 nm = 696 156 ± 145 km (ξ)
* 782.2 nm = 696 192 ± 247 km (ξ)
The solar radius observed results from small variations less than 50 mas and not in phase with solar activity. Moreover, there does not appear any correlation with the significant total solar irradiance variations.
Helioseismology - Rate of Rotation and Shape
The Sun may appear to be perfectly circular, but it is slightly flattened -- oblate -- at the poles. The precise shape -- asphericity -- is linked to interior rotation and its measurement is an independent way for validating the internal rotation rate and differential rotation. The 535.7 nm band of SODISM provided a distinctive opportunity to investigate solar oscillations from intensity variations observed at the limb and on the disc. Intensity data from SOHO/MDI and SDO/HMI were also used for comparison. It also detailed solar background noise leading to more reliable interpretation of helioseismic results by countering any interference caused by convective forces in the solar atmosphere.
The magnitude of the solar oblateness is an important parameter to constrain models of the solar interior. However, it is a difficult quantity to measure due to its very small value -- the difference in equator to pole radius is less than 10−3 arcsec. By rotation of the spacecraft step by step, the collected data allowed the determination of the solar oblateness and the distortion of the instrument optics: finding an equator pole change of 9 mas with a slight wavelength dependence. Full continuum images at 535.7 nm were recorded by SODISM every minute. Harmonic analyses of the images enabled researchers to invert the rotational splittings to infer the internal rotation rate down to the tachocline.
End of Operations
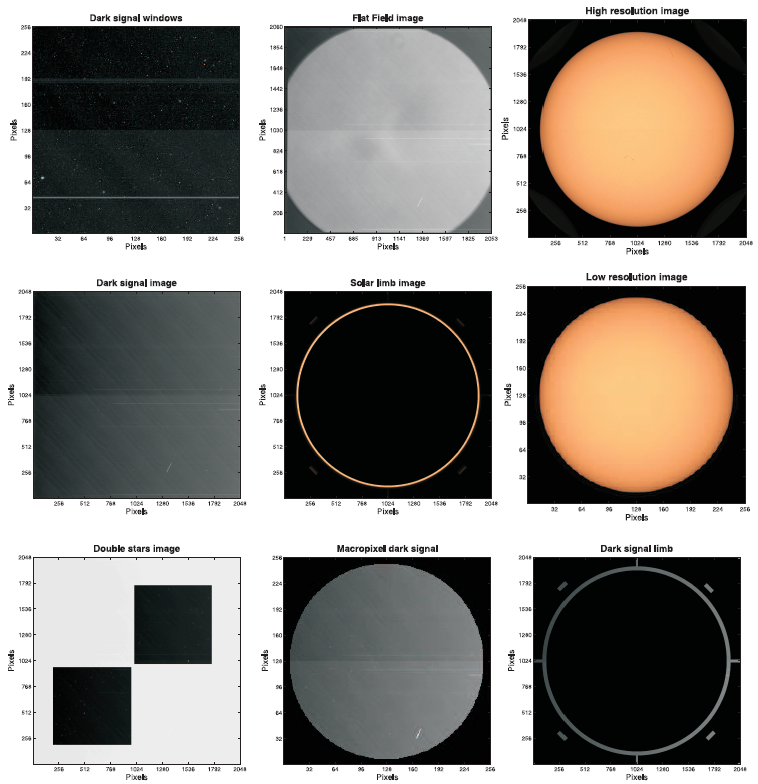
All kinds of L0 SODISM products. Credit: Mefta, M., et al.
Originally planned for 2 years, the PICARD ended its scientific operational mission in March 2013, but pursued acquisitions to the end of March 2014. The payload was particularly vulnerable, because its optical elements and radiators were exposed to unshielded solar radiation. The PICARD mission detailed the rising phase of the solar cycle 24 and studied the relationship between all the measurements simultaneously gathered.
From 2010 to 2014, the Picard satellite acquired more than a million pictures of the Sun, along with many other measurements. It extracted the connections between solar variability and climate changes and extrapolated the solar mechanics that drive those forces. Studies of the link between solar activity and climate show that variations in the solar irradiance have been too small to explain the Earth’s warming during the last century.
Works Cited
Committee on Earth Observation Satellites (CEOS). (nd.). PICARD Mission. https://database.eohandbook.com/database/missionsummary.aspx?missionID=416
Gérard Thuillier, Steven Dewitte, Werner Schmutz, (2006). Simultaneous measurement of the total solar irradiance and solar diameter by the PICARD mission, Advances in Space Research, *V. 38, Issue 8*. https://doi.org/10.1016/j.asr.2006.04.034.
Gérard Thuillier, Service d’Aéronomie du CNRS and The PICARD Team. (2009, June 9). The PICARD Mission. http://solar.physics.montana.edu/SVECSE2008/pdf/thuillier\_svecse.pdf
Luc Damé, Mireille Meissonnier, and Bernard Tatry. (nd.). PICARD MICROSATELLITE PROGRAM. https://solarnet.projet.latmos.ipsl.fr/fichiers\_pdf/Proc\_PICARD\_LaBaule.pdf
M. Rouzé, A. Hauchecorne, J.F. Hochedez, A. Irbah, M. Meftah, T. Corbard, Parc Valrose, S. Turck-Chièze, P. Boumier, S. Dewitte, and W. Schmutz. (2014, May 5-9). The PICARD Scientific Mission: status of the program. American Institute of Aeronautics and Astronautics, Inc. Space Ops 2014 Conference. https://arc.aiaa.org/doi/pdf/10.2514/6.2014-1705
Meftah, M., and Meissonnier, M., Irbah, A., Abbaki, S., Assus, P., Bertran, E., Dubois, J-P., Ducourt, E., Marcovici, J.P., Poiet, G., Vieau, A-J., and Thuillier., G. (2009, August 24). The Space instrument SODISM of the PICARD mission. https://api.semanticscholar.org/CorpusID:131325885
Meftah, M. and Irbah, A. (2011, September 9). The space instrument SODISM, a telescope to measure the solar diameter. DOI: 10.1117/12.891264
M. Meftah, T. Corbard, A. Hauchecorne, F. Morand, R. Ikhlef, B. Chauvineau, C. Renaud, A. Sarkissian, L. Damé. (2018). Solar radius determined from PICARD/SODISM observations and extremely weak wavelength dependence in the visible and the near-infrared. *A\&A 616 A64*. DOI: 10.1051/0004-6361/201732159
Meftah, M., Hochedez, JF., Irbah, A., Hauchecorne, A., Boumier, P., Corbard, T., Turck-Chi`eze, S., Assus, P., Bertran, E., Bourget, P., Buisson, F., Chaigneau, M., Dam´e, L., Djafer, E., Dufour, C., Etcheto, P., Ferrero, P., Hers´e, M. Marcovici, J.P., Meissonnier, M., Morand, F., Poiet, G., Prado, J.Y., Renaud, C., Rounet, N., Rouz´e, M., Salabert, D., and Vieau, A.J. (2014). Picard SODISM, a Space Telescope to Study the Sun from the Middle Ultraviolet to the Near Infrared. *Sol Phys 289, 1043–1076.* https://doi.org/10.1007/s11207-013-0373-x
Meftah, M., Meissonnier, M., Irbah, A., Abbaki, S., Assus, P., Bertran, E., Dubois, J-P., Ducourt, E., G. Dufour, Marcovici, J.P., Poiet, G., Vieau, A.J., and Thuillier, G. (2010). The space instrument SODISM and the ground instrument SODISM II. DOI: 7731. 10.1117/12.851227.
NASA Earth Sciences. (nd.). Solar Irradiance. https://earth.gsfc.nasa.gov/climate/projects/solar-irradiance/about
OSCAR - Observing Systems Capability Analysis and Review Tool. (2021, October 02). Instrument: SODISM. https://space.oscar.wmo.int/instruments/view/sodism

