Despite its life-supporting nature, the Sun can have hazardous effects on the tiny, heat-sensitive humans that live on Earth.
In addition to the common problems of skin damage and overheating, the Sun causes disruptive geomagnetic storms. These storms can damage satellites and affect a wide range of everyday technologies —i.e., anything connected to the internet. Space storms can also disrupt the electrical grid, inducing currents on the ground known as geomagnetically induced currents. If these currents reach power stations, they can physically damage transformers and strain the transmission system’s ability to compensate for abnormal voltage, potentially leading to a collapse.
While these geomagnetic storms may not match the physical damage or frequency of terrestrial hurricanes, our ever-growing dependence on electricity in general —and the internet specifically— means that space storms impose a massive economic cost and infrastructure strain. Given the continental-scale of these storms, building a forecasting system to provide advance notice and properly mitigate damage remains an essential obligation.
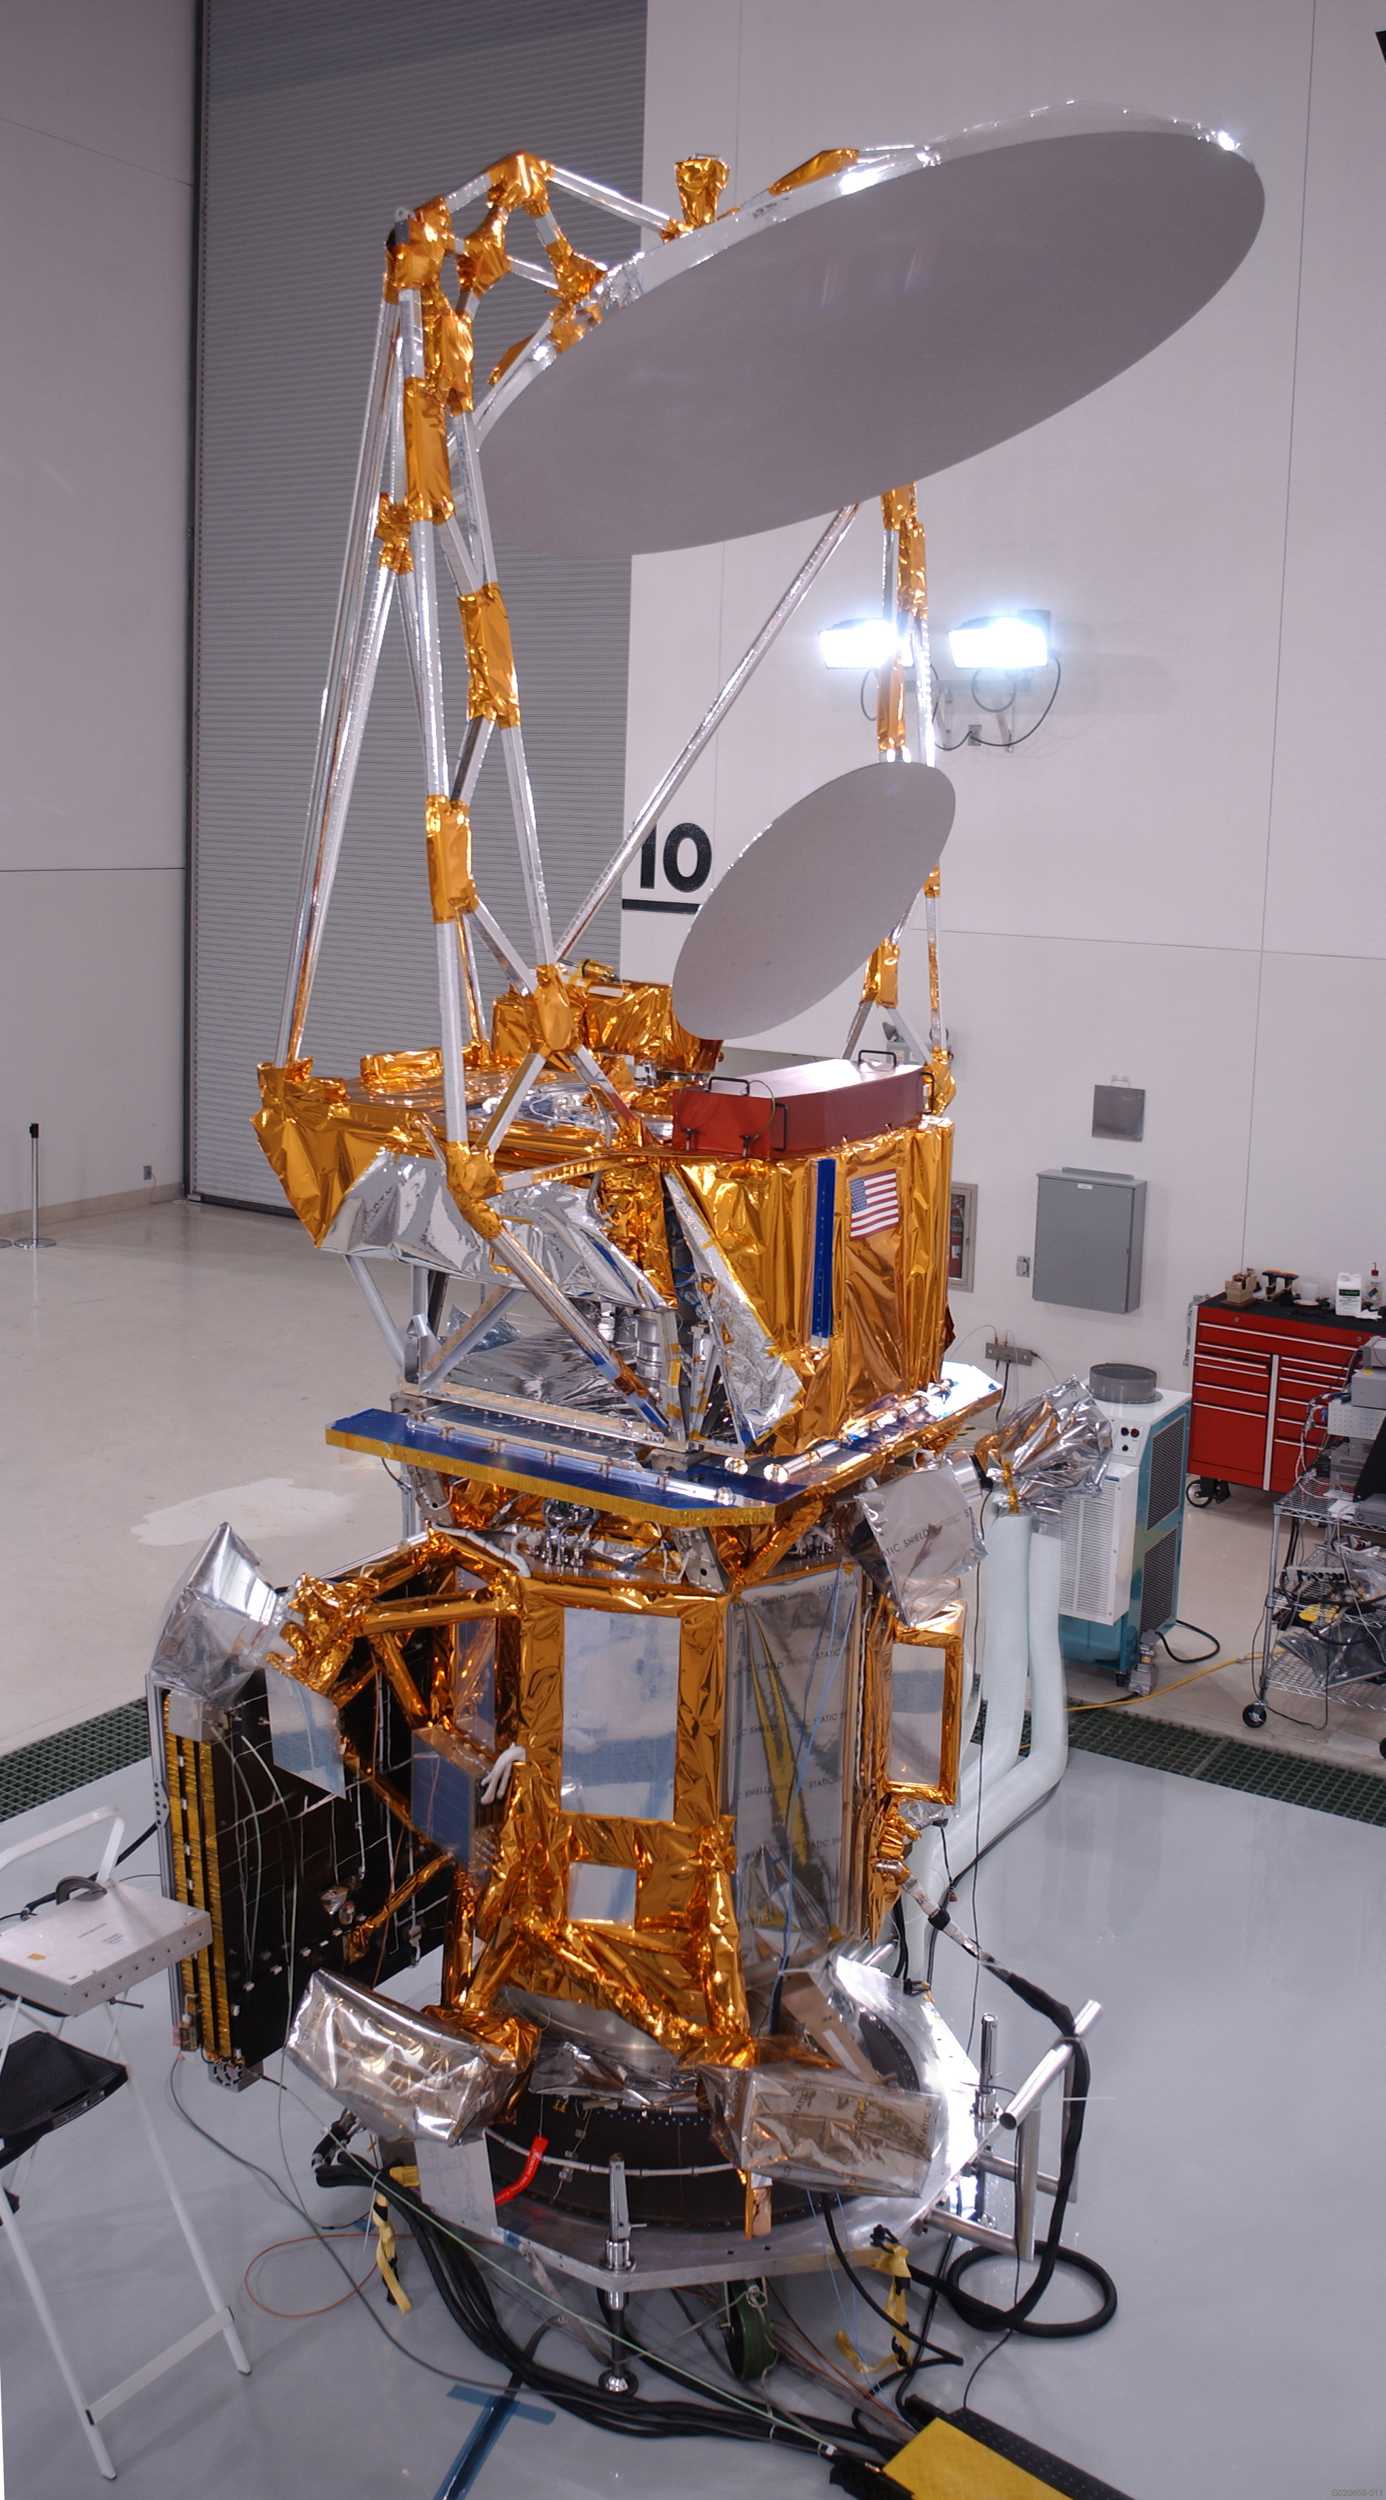
Credit: USAF, University of Birmingham
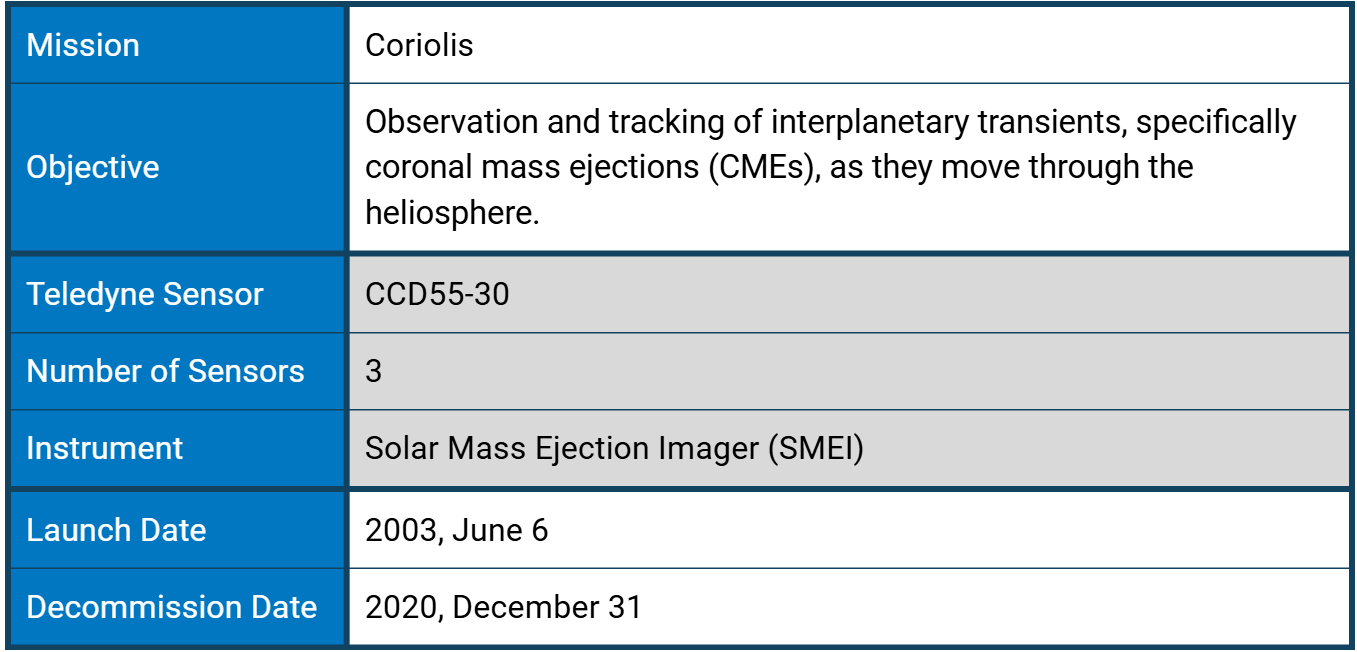
Launched in 2003, Coriolis was a U.S. Air Force "Space Test Program" and Space and Naval Warfare Systems Command (SPAWAR) meteorological mission that successfully field-tested remote-sensing heliospheric polarimetry to measure ocean wind speed/direction and to make accurate predictions of geomagnetic storms. The satellite validated new instrument technology for future environmental monitoring missions, ensuring the instruments met the requirements of the National Polar-orbiting Operational Environmental Satellite System (NPOESS).
What Causes Geomagnetic Storms?
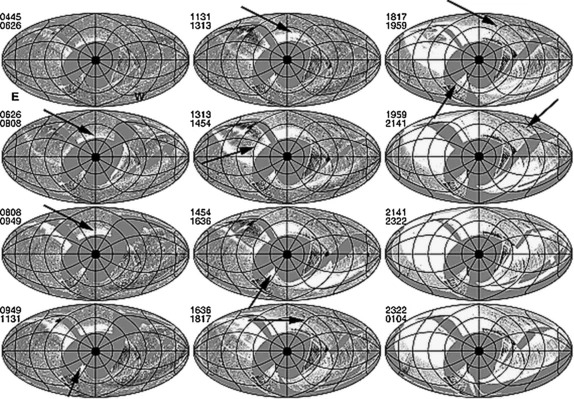
Early SMEI Aitoff sky maps showing the first geoeffective CME of the SMEI mission. The sequence shows almost a complete day of maps and moves from top to bottom, left to right, with the start and end times provided in the top-left of each map. The ICME appears as two arcs (arrowed) in the SMEI sky maps: a large arc moving northward (upwards); and a small arc moving towards the southeast (down-left). Credit: S.J. Tappin et al.
Churning plasma —ionised gas of free electrons and positively charged ions— inside the Sun generates magnetic fields that loop through the Sun in ever tighter twists and coils until they “snap” in an event known as magnetic reconnection. The electromagnetic energy released creates a solar flare, which –if powerful enough– will produce a wave of highly charged plasma and magnetic energy particles, called a coronal mass ejection (CME). The most energetic waves are powerful enough to reach the Earth, forming an interplanetary coronal mass ejection (ICME). ICMEs have complex magnetic and density structures that result from their interactions with the structured solar wind, previous eruptions, and perhaps other conditions yet to be discovered.
Observations of the elastic scattering of electromagnetic radiation by a free charged particle –Thomson scattering– are the best tool scientists have for direct measurement of ICMEs. Ground-based instruments can gather data only in the immediate vicinity of the Sun –out to 0.15 AU– as interference from Earth's airglow obscures those faint oncoming solar signatures. Even under the favourable viewing conditions of a solar eclipse, the direct angle of sunlight as measured from Earth restricts observations to a narrow range of angular scales.
Solar Mass Ejection Imager (SMEI)
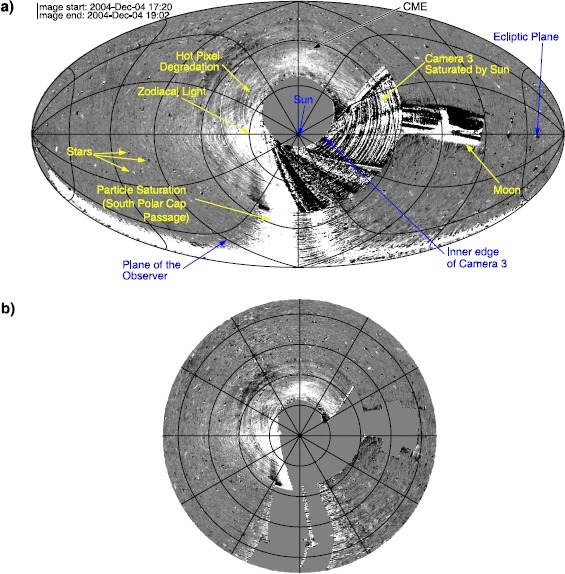
Examples of a complete SMEI sky map in Sun-centred ecliptic coordinates. (a) Hammer-Aitoff projection (from Tappin et al. 2012), with various features noted. (b) The Sunward portion of the same map in an equal-radius “fisheye” projection, extending out to elongations ε<135∘ from the Sun. The circles (in (b)) and near-circles (in (a)) mark 30∘ contours in ε, whereas the more radial lines coming out of the Sun mark position angle (increasing counterclockwise with zero at ecliptic north). Several features are labelled, and in panel (a) the sources of noise have been explicitly left unmasked to show their appearance in an SMEI sky map. In panel (b), the noise sources have been masked out (solid grey). These sources are the Sun, Moon, Venus, dark charge and electronic bias, and excessive particle noise. Credit: T.A. Howard et al.
Scanning interplanetary space from a dawn-to-dusk LEO, SMEI mapped the region between the Earth and the Sun, observing time sequences of heliospheric phenomena propagating from the Sun, and forecasting their arrival at Earth. SMEI was the first of a new class of heliospheric and astronomical white-light imagers that performed differential photometry with unprecedented accuracy to trace variations in electron densities across the full sky. This enabled the deconvolution of the detailed distribution of heliospheric material along the line of sight. In other words, data from SMEI was used to calculate solar angular distances from Earth to study the size, shape, speed, frequency, energy flux, pressure, mass, and momentum of ICMEs.
A heliospheric imager —like SMEI— operates in a fashion similar to coronagraphs: it observes solar photospheric white light that has been Thomson scattered by free electrons in the solar wind plasma. Compared to traditional coronagraphs, the SMEI observes much larger angles from the Sun, up to 90°. Thus, it required a much higher sensitivity and wider dynamic range for the measured intensity.
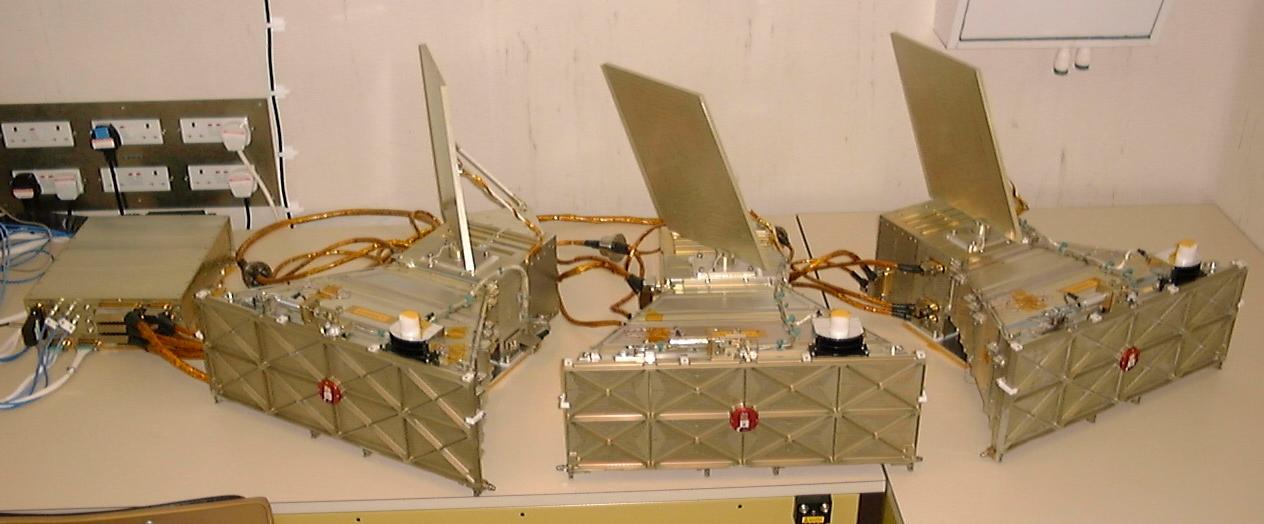
The flight model DHU was thermally tested to acceptance level in the tank at Birmingham. This is a picture of the post-test bench test configuration in the cleanroom. Credit: USAF, University of Birmingham, Mark Cooke
The SMEI sensor suite consisted of three wide-angle CCD cameras, each covering a 3° × 60° strip. The cameras were aligned with slightly overlapping FOVs to produce a composite swath of 3° wide by 160° long that swept along an approximate great circle with the ends near the orbit axis. Since Coriolis had zenith-nadir pointing, SMEI covered nearly 90% of the entire sky during each orbit. Imaging nearly all the sky every 102 minutes —the spacecraft's orbital period— the instrument operated continuously, performing a sequence of 14 orbits of images per day. Importantly, SMEI could accurately reproduce angular registration to maintain continuity for every orbit over each sky region and across the duration of heliospheric structure passage —hours to several days— by separating solar optical radiation from other sources of background light.
SMEI was designed to control and compensate for this stray-light background. Stellar background brightness varies significantly from the Milky Way to the galactic poles. Orbital motion swept the SMEI camera’s narrow dimension over any given sidereal location in a minimum of approximately 50 seconds, and a sufficiently accurate value for stars needed to be recorded along with the background sky brightness despite this motion. In order that stellar and other bright background signals, such as zodiacal light, did not overwhelm the dim heliospheric signal, SMEI needed to precisely isolate stellar signals so that heliospheric structures could be measured to a fraction of their intensities. Thus, SMEI supported a 0.1% differential photometric specification for all signals incident on the SMEI focal plane at 90◦ elongation in one square degree of sky in a single camera passage. This enabled very high sensitivity and photometric stability to detect faint transient disturbances against a much brighter background that could be two orders of magnitude brighter.
Other methods for eliminating background light led to the detection of faint CME signals. Using a method called “running differences”, researchers removed background signals by taking the difference between the image for the current orbit and the image for either the immediately preceding orbit or the average of several preceding orbits. These orbit-difference image maps are called “near real time difference” (NRTD) maps. This technique efficiently removes the main background signals and fixed instrumental artefacts, but requires that the target objects move or change significantly from orbit to orbit. In effect, a constant heliospheric signal cancels out in the difference map, leaving only the changes in heliospheric structures from one orbit to the next. CMEs and other heliospheric features that were too faint to be detectable on direct-orbit maps or in movies derived from them became readily observable as moving structures in movies of the NRTD maps. The near-real-time images show that CMEs appear more structured nearer the Sun.
Each of the three SMEI camera units focused images on a CCD55-30. The unfiltered CCDs recorded broadband white light with a red-biased spectral response from ~0.4 to 1.1 μm, peaking at 0.7 μm. This supported the required sub-pixel gradient response to reproduce stellar point images as they changed position in the FOV. The basic spatial resolution of the on-board binned pixels was 0.2º.
The CCD detectors operated in frame-transfer mode. To provide a reproducible photometric response with the extremely fast (∼f /1) SMEI optics, unresolved point images occupied ~200 CCD pixels, or about 1/2 square degree, with each square degree of sky containing an average of 120 S10 units of equivalent stellar signal and one star of eighth or brighter magnitude. The integration time for each CCD camera frame was 4 seconds. The raw frames from two cameras were averaged over 4 × 4-pixel bins on board the spacecraft before transmission to the ground, while 2 × 2-pixel binning was used for the sunward camera due to thermal effects. The heliospheric sky brightness is large enough that CCD readout noise is not a significant factor for the SMEI camera systems when operated at the appropriate temperature.
Each camera also had a baffle to minimise stray light reaching its detector, including illuminated spacecraft appendages and instrumentation, as well as Earthshine. Additionally, the SMEI instrument was mounted on a Coriolis platform to point away from Earth, thereby eliminating most Earthshine interference.
How Do Scientists Use SMEI Data?
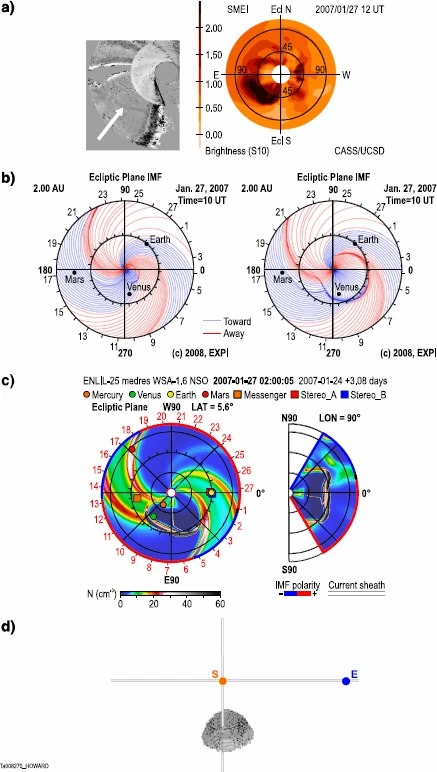
Results for the three-dimensional reconstruction of CMEs using methods employed throughout the SMEI mission. These are for a CME observed on 27 January 2007. Panels (a)–(c) are from Webb et al. (2009a). (a) SMEI fisheye sky map (left) and fisheye tomographic reconstruction (right) using the CAT technique at 12 UT. The white arrow shows the CME in the SMEI sky map. (b) HAFv2 solar wind disturbance reconstruction at 0 UT on the previous day (left) and at 10 UT (right), looking down onto the ecliptic plane and showing the orientation and polarity of interplanetary magnetic field lines. (c) WSA-ENLIL + CONE MHD solar wind injection reconstruction on 02 UT, showing the density of the solar wind and looking down onto the ecliptic plane (left) and along the north-south meridian (right). (d) TH model reconstruction, looking down onto the ecliptic plane from the north. In panels (b)–(d), the locations of the Sun and Earth are shown, and all four models show considerable agreement, with the reconstructed CME moving along the eastern limb, perpendicular to the Sun-Earth line (i.e., a limb CME) and somewhat to the south. Credit: T.A. Howard et al. Study: https://doi.org/10.1007/s11214-013-9992-7
Scientists rely on numerical simulation models to investigate the physical processes that drive the development of ICMEs:
Deceleration of ICMEs in the heliosphere
Interaction of ICMEs with the bimodal solar wind and their associated deformation
Association of magnetic clouds observed in situ with CMEs
Combinations of multiple ICMEs to form complex ejecta
The complexity of these numerical models has steadily increased, from simple one-dimensional (1-D) hydrodynamic (HD) and magnetohydrodynamic (MHD) models in the 1970s to 2-D MHD models in the 1980s and 1990s. More recently, axisymmetric 3-D models and fully 3-D MHD models have been developed and used to study ICMEs. SMEI's measurements allowed scientists to test the accuracy of these models and constrain them. With positive confirmations of ICMEs observed by SMEI and other missions with Teledyne technology, such as STEREO's SECCHI, scientists can trace observational data across different instruments and examine overlapping timeframes to help determine the origins of the fronts observed by those instruments.
Achievements:
As the SMEI instrument observes the whole sky, it also observes periodic changes in the brightness of stars. This data has been used to detect asteroseismological oscillations in giant stars.
SMEI's high sensitivity enabled the observation and tracking of very faint comet remnants over much longer temporal and spatial scales than possible from the ground. Researchers found that a CME front was the probable cause of the Comet Neat tail disconnection on 5–6 May 2004, which began on 5 May, when SMEI observed a broad, wide transient arc sweeping past the comet nucleus and tail.
SMEI demonstrated the ability to detect Earth-directed ICMEs well in advance of their arrival, providing 1-3 day warnings. Normally, it can take two to five days for solar energy to arrive at Earth.
SMEI routinely imaged almost the entire sky in white light to better than a 10th-magnitude level per square degree, producing up to 15 sky maps per day with a 102-minute cadence and 1° spatial resolution.
A series of images collected by SMEI. As the Coriolis spacecraft moved through its Sun-synchronous polar orbit, the SMEI cameras swept out nearly the entire sky in a pushbroom fashion. Due to the geometry of the orbit and the need to keep direct sunlight out of the SMEI cameras, there is an exclusion zone with a diameter of roughly 20 degrees in the sunward direction. There is also a smaller exclusion zone in the anti-sunward direction. Using the Hammer-Aitoff projection, multiple images were combined into single "fisheye" images of the sky, creating an equal-area map projection that displays the celestial sphere on an ellipse. For SMEI, the Hammer-Aitoff images are centred on the Sun, and the point in the anti-sunward direction —from Earth's perspective— is mapped to the outer ellipse. This way, disturbances from the Sun will appear to originate at the centre of the image and propagate outward as they travel to 1 A.U. and beyond. Credit:https://nso.edu
SMEI was at the forefront of space weather observation. The global atmospheric data collected by SMEI improved the accuracy of space weather forecasting and increased lead times, helping mitigate the harmful effects of the Sun on spacecraft and ground systems. Additional missions such as SDO and GOES have gone on to advance the scientific models and prediction systems initiated by SMEI. Despite these contributions, electrical power limitations led researchers to deliberately shut down the instrument in 2011 —after almost nine years of successful operation.
The unique dataset it gathered provided many opportunities for scientific advancements, not just in solar physics and space weather forecasting, but also in scientific fields, including studies of corotating interaction regions (CIRs), the high-altitude aurora, zodiacal light, Gegenschein counterglow, comet tail disconnections and motions, and variable stars. SMEI tracked heliospheric CMEs out to and beyond 90∘ elongation, and continued to observe them right up until its last day of operation, detecting a CME in the last hours of operation. A total of 391 CMEs have been confirmed throughout the mission.
As of 2013, the number of peer-reviewed papers involving SMEI totalled 113, with an additional 195 post-launch publications and conference proceedings and 32 press releases or public articles. These numbers continue to increase.
Works Cited
eoPortal. (2026, January 25). Coriolis/WindSat. https://www.eoportal.org/satellite-missions/coriolis
Howard, T.A., Bisi, M.M., Buffington, A. et al. (2013, June 13). The Solar Mass Ejection Imager and Its Heliospheric Imaging Legacy. Space Sci Rev 180, 1–38. https://doi.org/10.1007/s11214-013-9992-7
Jackson, B.V., Buffington, A., Hick, P.P. et al. (2004, November). The Solar Mass-Ejection Imager (SMEI) Mission. Sol Phys 225, 177–207. https://doi.org/10.1007/s11207-004-2766-3
N. Lugaz, N., and Roussev, I. I. (2010, August 31). Numerical Modeling of Interplanetary Coronal Mass Ejections and Comparison with Heliospheric Images. Institute for Astronomy, University of Hawaii–Manoa, Honolulu, HI, USA. https://arxiv.org/pdf/1008.5394
Tarrant, N. J., Chaplin, W. J., Elsworth, Y., Spreckley, S. A., Stevens, I. R. (2018, October 29). School of Physics and Astronomy, University of Birmingham . Asteroseismology of red giants: photometric observations of Arcturus by SMEI. https://doi.org/10.48550/arXiv.0706.3346
University of Birmingham. (n.d.). Solar and Heliospheric Physics: SMEI. http://www.sr.bham.ac.uk/solar/smei.php
Webb, D. F., et al. (2006), Solar Mass Ejection Imager (SMEI) observations of coronal mass ejections (CMEs) in the heliosphere, J. Geophys. Res., 111, A12101, doi:10.1029/2006JA011655

