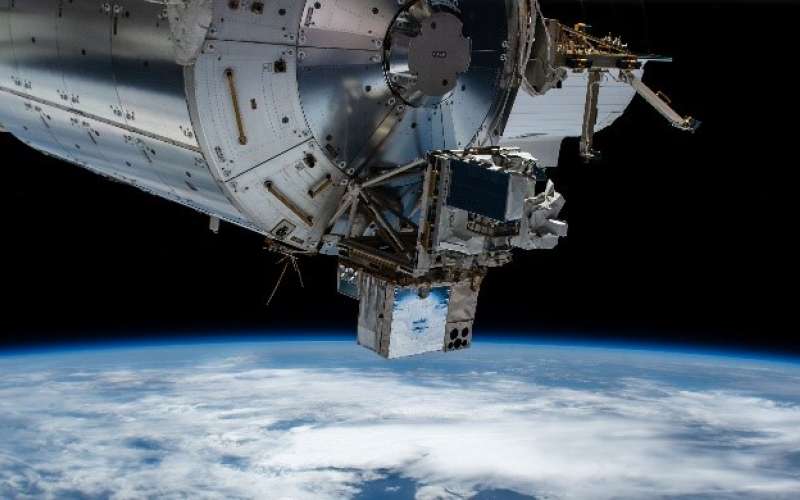
A testament to collaboration between industry, governments, researchers, and policymakers, the International Space Station (ISS) maintains one of the most dynamic and consequential repositories of scientific data. Orbiting for over 20 years, the ISS has and continues to host dozens of laboratory experiments, astronauts, and up to 20 scientific instruments in support of humankind. It is one of the most productive long-term research platforms–a wellspring of environmental knowledge.
Teledyne Space Imaging developed and produced focal plane arrays on four instruments flying on the ISS. Three instruments–EMIT, ECOSTRESS, and OCO-3–are part of NASA’s Earth System Science Pathfinder Program. The last instrument featured in this article–Airglow–is funded by the nonprofit Aerospace Corporation.
The United States, Japan, Canada and participating European Space Agency (ESA) countries have pledged to support ISS operations until 2030.
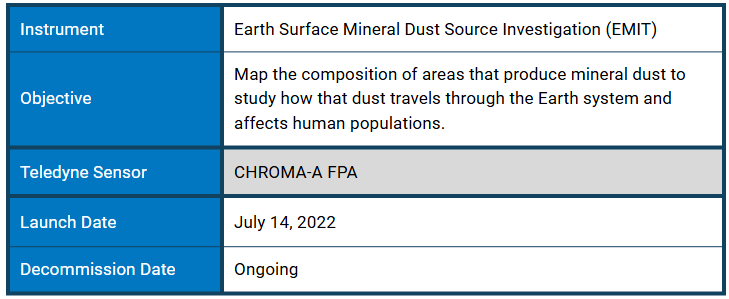
Built by NASA’s Jet Propulsion Laboratory (JPL), the Earth Surface Mineral Dust Source Investigation (EMIT) measures the mineral composition of Earth’s dust, enabling new insights into how those aerosols impact our planet. Despite a minuscule size, aerosols have a demonstrable effect on the Earth’s carbon cycle. On the surface, they feed plant life and can melt snow, while high in the atmosphere, they change the chemical composition, contributing to cloud formation and global warming.
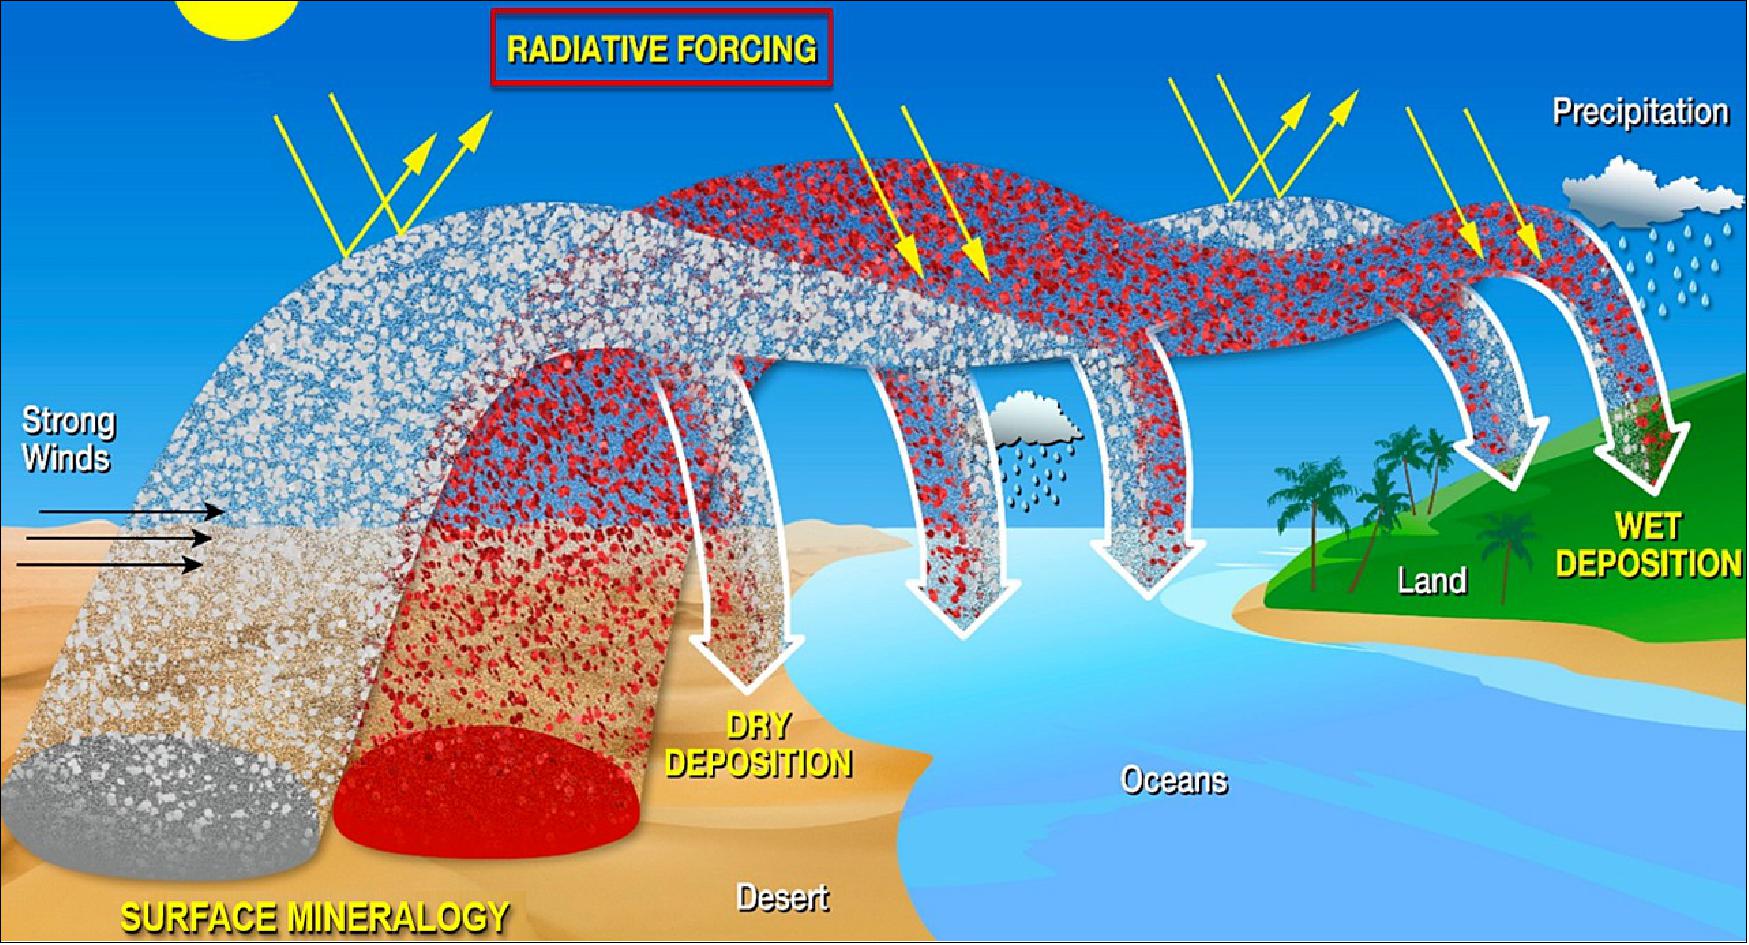
The chemical structure and optical properties of soil particles vary strongly with the mineral composition of the source. Wind lifts lightweight surface particles into the atmosphere, where high-speed currents transport them around the globe. These particles heat or cool the surrounding air by absorbing or reflecting sunlight–a process known as radiative forcing. Credit: NASA
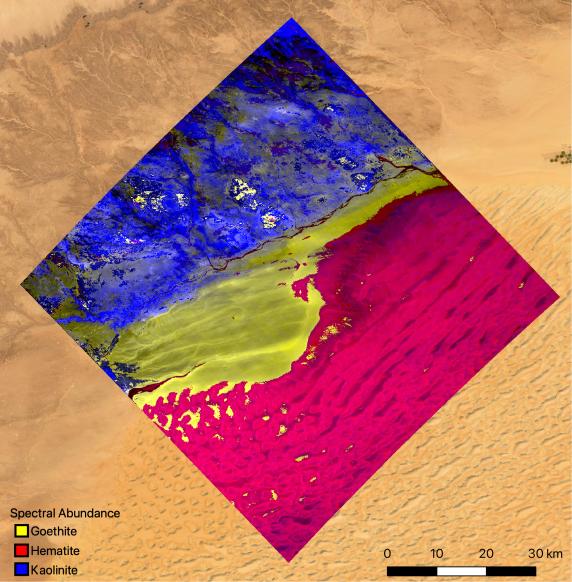
As EMIT maps the global mineral content, scientists can focus on places that create aerosols–such as drought areas and arid deserts. This mineral map of of South-West Libya, shows areas dominated by kaolinite, a light-scattering clay material, and goethite and hematite, iron oxides that absorb heat and warm the surrounding air. Credit: NASA/JPL-Caltech
 Credit: NASA
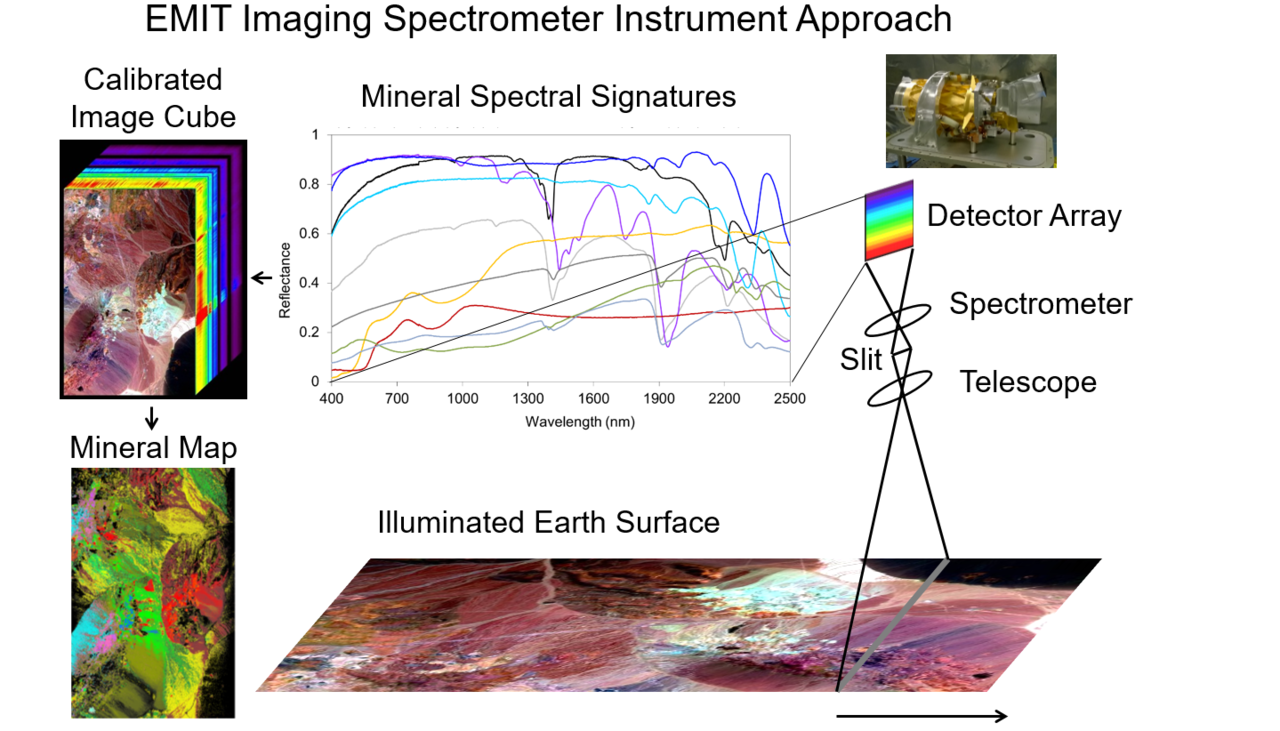
Mounted externally on the ISS’s ELC1, EMIT scans the surface to comprehensively map mineral composition. Using a high-fidelity imaging spectrometer and telescope, it collects the light reflected from the Earth dividing the spectrum into 286 wavelengths spanning visible, ultraviolet and short-wave infrared.
Teledyne Space Imaging’s CHROMA-A 1280 x 480 pixel detector array uses custom, variable, anti-reflection coatings to maximize light sensitivity from 380 to 2500 nm. With over 600,000 pixels, EMIT produces a spatial resolution of 60 meters with a 75 kilometer viewing swath.
The focal plane array on the EMIT spectrometer, builds on Teledyne’s experience developing technology for another aerosol-focused mission–CNES’s PARASOL.
A Dyson optical layout provides exceptionally high photon throughput, enabling the detector to acquire over 100,000 spectra every second. Scientists can then examine the spectral signature to identify the distinctive signatures of all the unique materials on the Earth, including surface minerals, vegetation type and health, and greenhouse gas emissions.
The data collected by EMIT charts how the planet's dust cycle impacts entire ecosystems–affecting air quality, human health, biodiversity, and extreme weather events. That data is also fed to climate models to advance their accuracy to predict how Earth systems could respond to different climate projection scenarios.
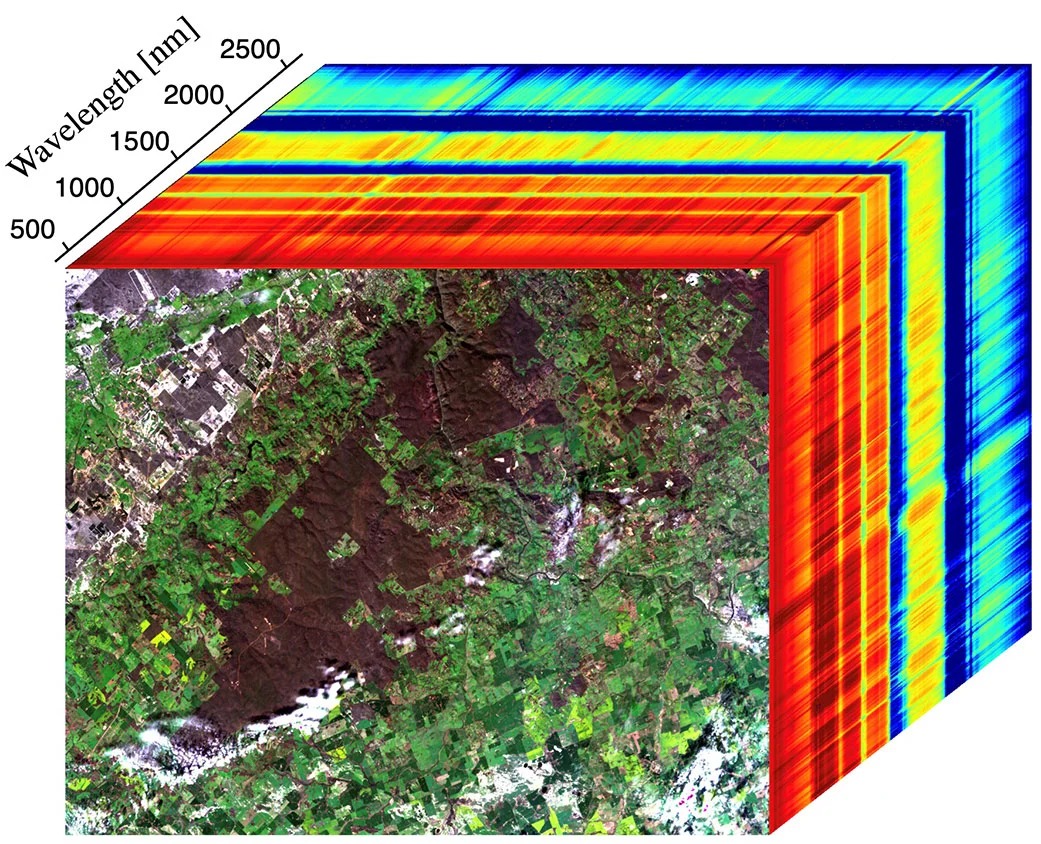
This image shows the first measurements taken by EMIT on July 27, 2022, as it passed over Western Australia. The image at the front of the cube shows a mix of materials in Western Australia, including exposed soil (brown), vegetation (dark green), agricultural fields (light green), a small river, and clouds. The rainbow colors extending through the main part of the cube are the spectral fingerprints from corresponding spots in the front image. Credit: NASA/JPL-Caltech
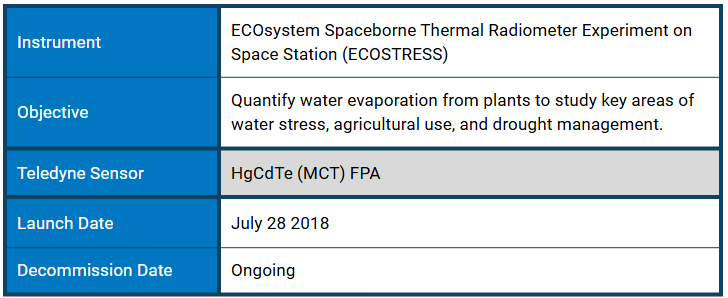
ECOsystem Spaceborne Thermal Radiometer Experiment on Space Station (ECOSTRESS) is a multispectral thermal infrared radiometer configured to measure plant water evaporation and surface temperature. The collected data helps scientists study water stress, drought, water use efficiency, and land use. Understanding vegetation water stress could link water availability changes in the terrestrial biosphere with the global carbon cycle.
Plants regulate their temperature by releasing water through tiny pores on their leaves called stomata. With sufficient water, plants maintain their temperature, but insufficient water causes their temperature to rise. By tracking these diurnal trends in vegetation evapotranspiration, ECOSTRESS data is instrumental to producing temperature maps of the highest detail acquired from space. A temperature sensitivity of ≤0.1 K enables ECOSTRESS to measure the temperature of an individual farmer's field to potentially identify agricultural vulnerabilities.
Installed on Kibo – the Japanese Experiment Module – ECOSTRESS follows the orbit of the ISS, employing a whiskbroom configuration to scan the Earth. A double-sided scan mirror produces a 53° wide nadir swath with a 38-m in-track by 69-m cross-track spatial resolution. The optical signal is focused by a telescope onto the 65 K focal plane containing a custom, mercury-cadmium-telluride (MCT) infrared detector array with 13.2 µm cutoff. Spectral filters on the focal plane define 5 spectral bands in the 8-12.5 µm range and an additional band at 1.6 µm for geolocation and cloud detection–six bands total. Each of the channels has a different full well capacity optimised to match the peak signal in each band.
JPL built and manages the ECOSTRESS mission for the Earth Science Division in the Science Mission Directorate at NASA Headquarters in Washington. ECOSTRESS is an Earth Venture Instrument mission; the program is managed by NASA's Earth System Science Pathfinder program at NASA's Langley Research Center in Hampton, Virginia.
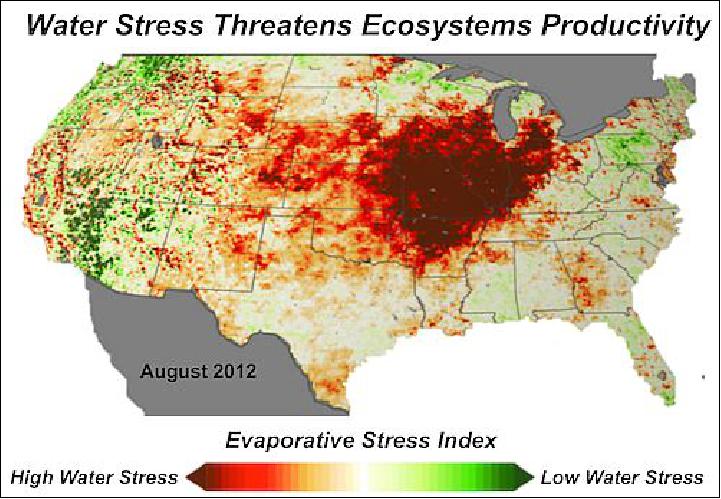
ECOSTRESS data is used to produce an Evaporative Stress Index to help identify areas at risk of drought. Taken over August 2012, this map of the United States shows differences in water stress. Red areas indicate high water stress–drought conditions–and green areas indicate low water stress–non-drought conditions. Credit: NASA/JPL
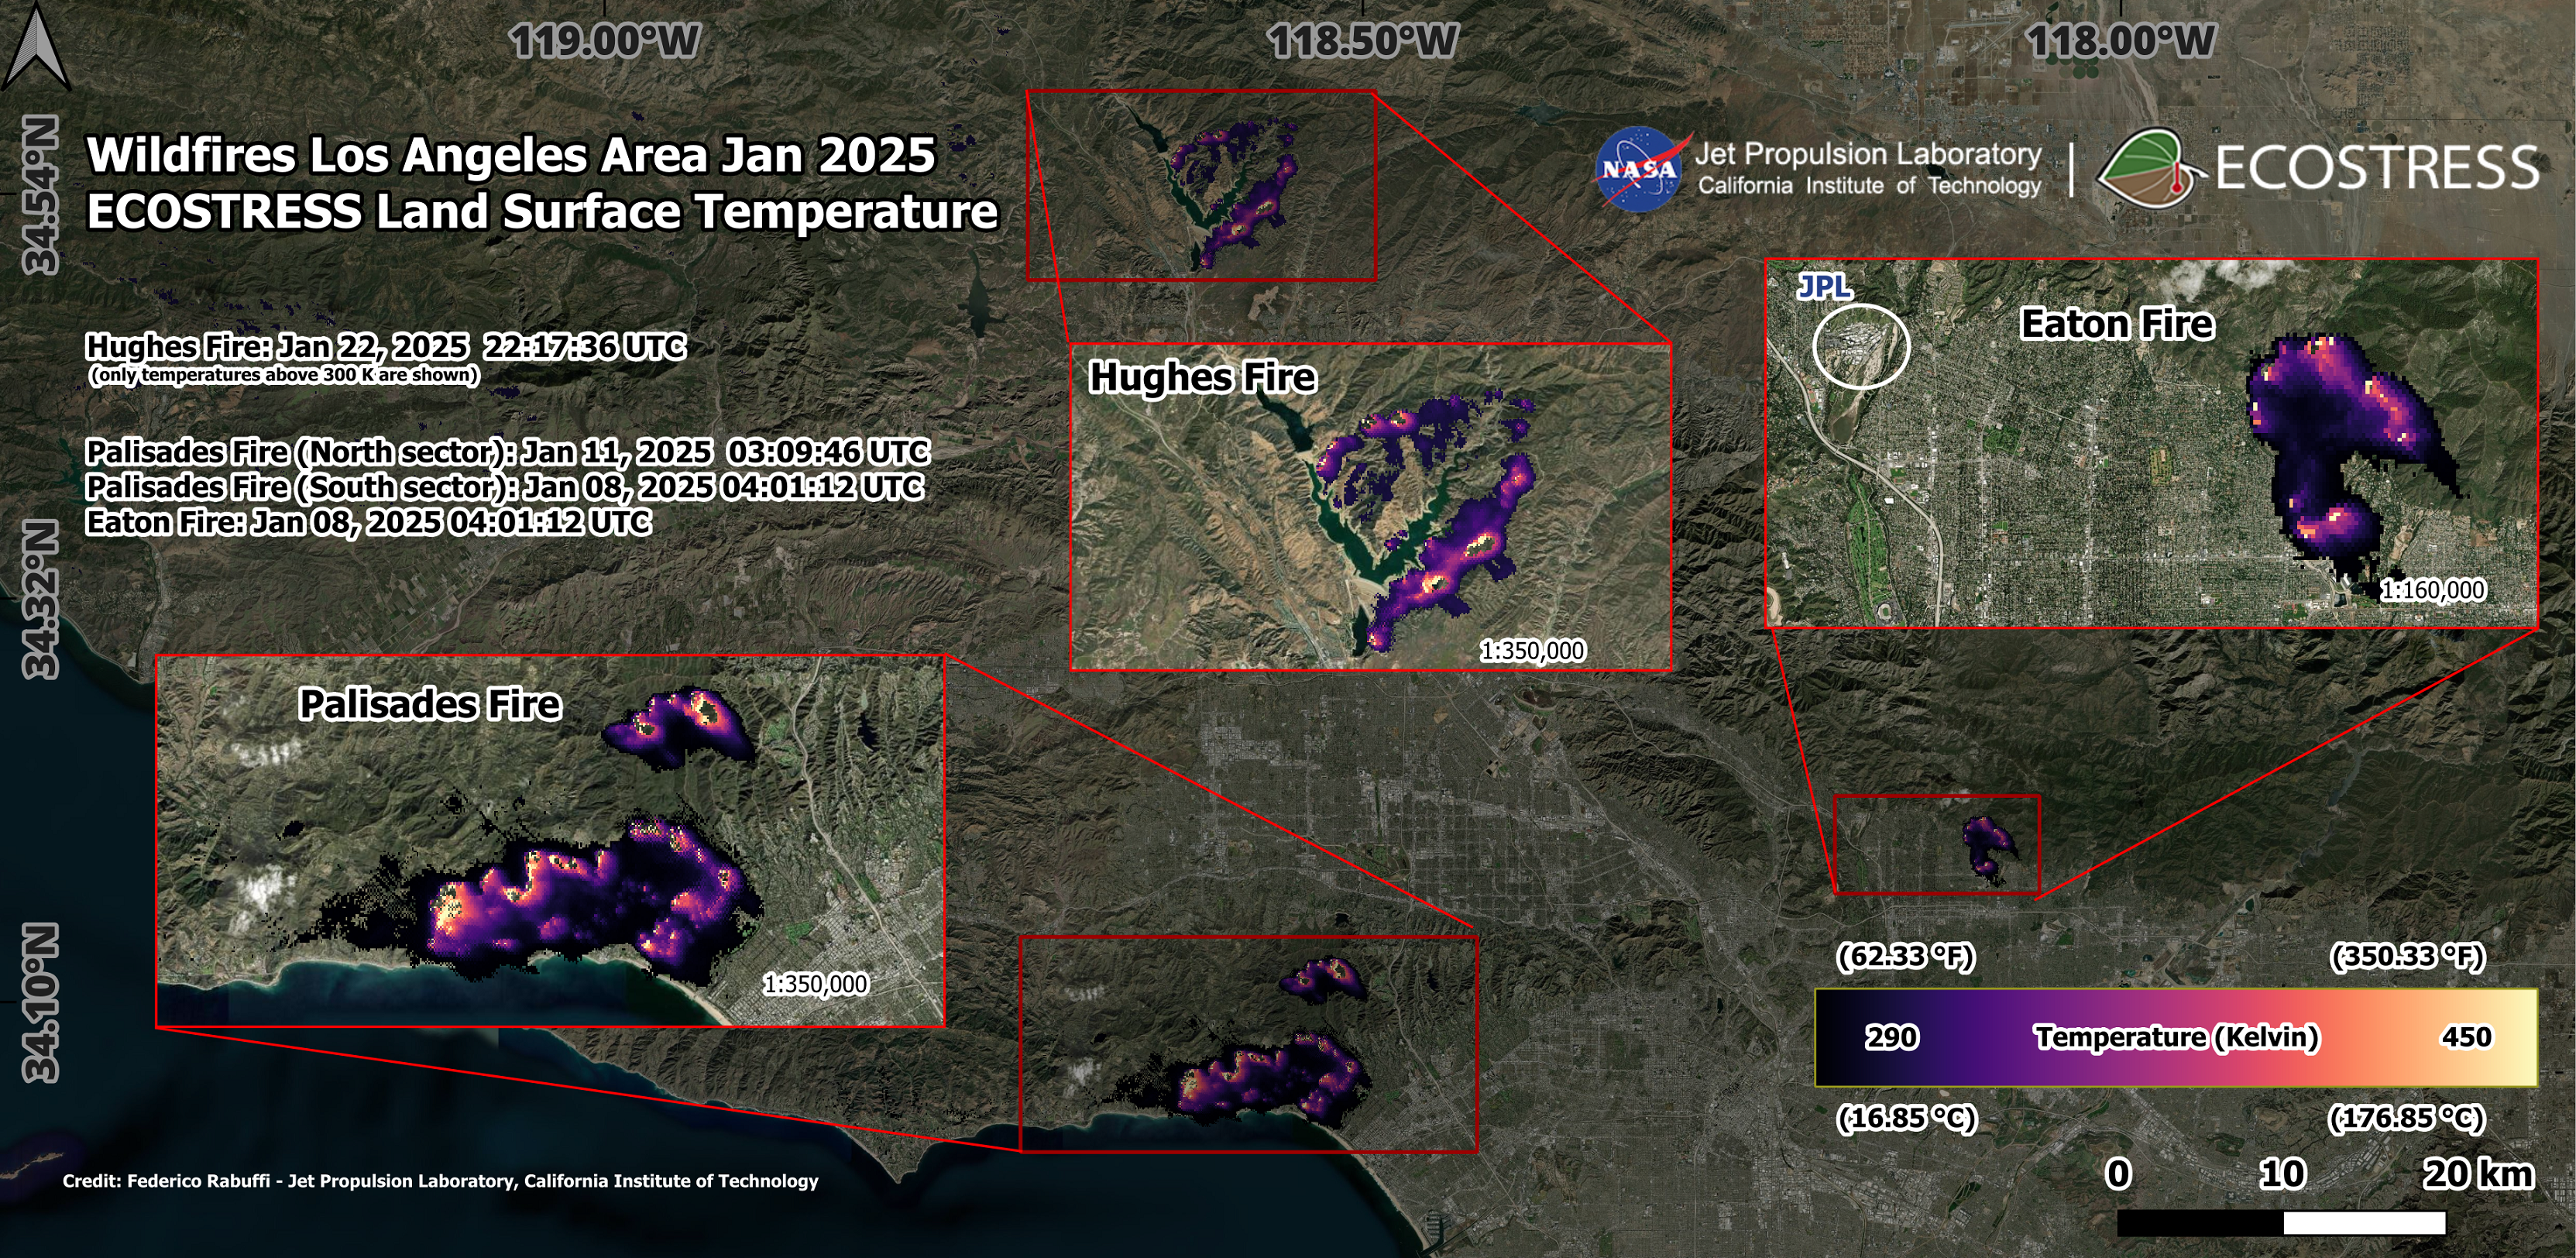 ECOSTRESS data is also used to produce Land Surface Temperature (LST) maps to help locate and track Los Angeles county wildfires over several weeks. The temperature data, shown on a black – purple – yellow color ramp, represent values ranging from 290 K (16.85°C / 62.33°F) to 450 K (176.85°C / 350.33°F), providing critical insights into fire intensity and spread. Credit: NASA/JPL-Caltech
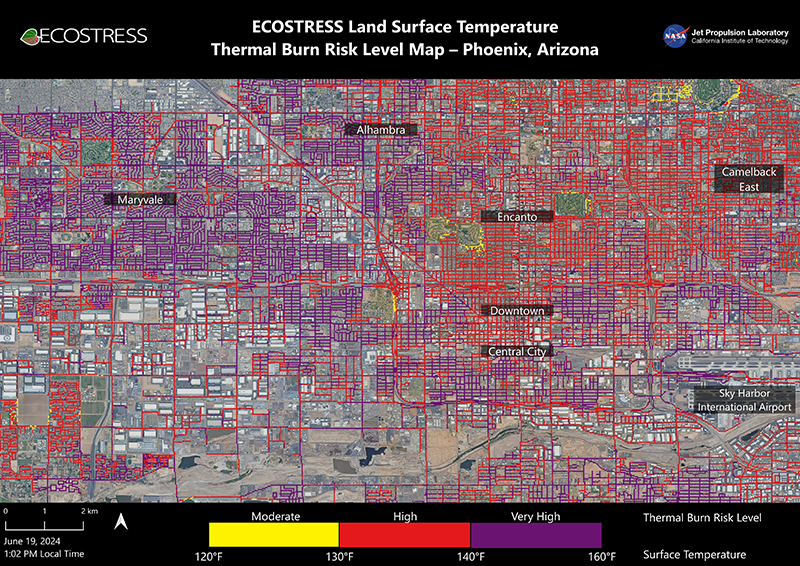 This image, taken June 19th, 2024, shows how miles of asphalt and concrete surfaces–colored here in yellow, red, and purple, based on temperature–trap heat. The surfaces registered at least 49 degrees Celsius (120 degrees Fahrenheit) to the touch which is hot enough to cause contact burns in minutes to seconds. Areas around the city with more green space are cooler. The ECOSTRESS data was combined with measurements taken by NASA/USGS Landsat and Sentinel-2 to "sharpen" the surface temperatures to a resolution of 30 x 30 meters (100 feet). Credit: NASA/JPL-Caltech
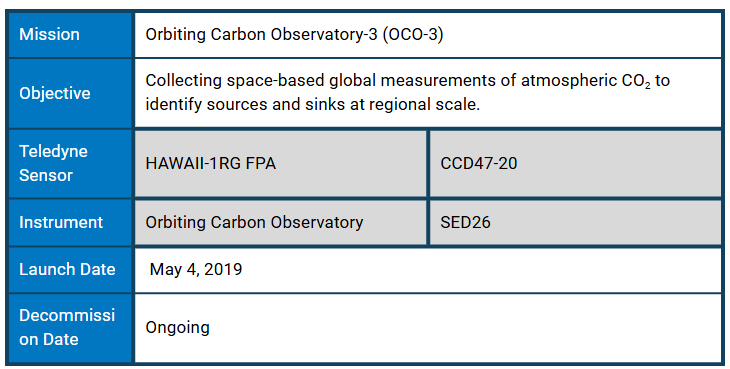
Built by NASA-JPL, the Orbiting Carbon Observatory-3 (OCO-3) consists of three high-resolution spectrometers illuminated by a common telescope. One spectrometer measures the absorption of sunlight by atmospheric O2 using a silicon detector, and the other two measure sunlight absorption by CO2 at two different wavelengths using HgCdTe detectors. The CO2 to O2 ratio is used to determine the concentration of atmospheric CO2 that averages to 405 ppm. OCO-3 measures this tiny percentage with 0.5 percent accuracy.
The OCO-3 instrument is essentially a copy of the spectrometer on the OCO-2 satellite. However, as OCO-3 travels on the Japanese Experiment Module, it will follow the ISS’s low Earth orbit, differing from OCO-2’s polar orbit which locks observation times to the same time every day. Accordingly, OCO-3 can map changes in CO2 concentration throughout the day as the station’s orbit carries it over a location earlier on each orbit, spanning all sunlit hours within about a month.
Global depression of terrestrial photosynthesis
OCO-3 can observe radiation produced by photosynthesis called solar-induced fluorescence. CO2 absorption by plants occurs only when they are actively photosynthesising. As the changing climate affects growing seasons worldwide, researchers need to understand when photosynthesis is occurring.
This fluorescence data helps calculate gross primary production–the total amount of an ecosystem’s carbon captured by photosynthesis. Vapour pressure deficit–the difference between the amount of moisture in the air and the amount of moisture the air can hold when it’s saturated–regulates the diurnal peak of photosynthesis. Most environmental models underestimate this effect, with a majority set to calculate photosynthesis peaking in the afternoon.
Data collected by OCO-3 demonstrated that a high vapour pressure deficit shifts peak gross primary production to earlier morning hours. This was particularly apparent in drylands and areas with short vegetation.
The Amazon’s Carbon Sink Might be Draining
The incredible amount of biomass stored in Amazonian rainforests serves as a substantial carbon stock. Increasing global temperatures could dry out the Amazon harming the regional–if not global–carbon budget. Declining photosynthesis and evapotranspiration could impact cloud formation resulting in less rainfall, stressing plant life and decreasing their carbon uptake.
Star Tracker
Teledyne Space Imaging produced the CCD47-20 on the SED26 star tracker responsible for maintaining the correct orientation of the OCO-3 spectrometer array.
Containing the outermost layers of the atmosphere, the ionosphere is constantly energized by extreme ultraviolet radiation from the Sun until molecules break apart, giving rise to a mix of charged ions and electrons. It responds to both terrestrial weather from below and solar energy from above, forming a complex space weather system. Turbulence in this ever-changing sea of charged particles can disrupt communication networks, navigation signals, and spacecraft in general. Accordingly, the behavior and composition of the ionosphere can be extremely variable, obscuring efforts at study.
When atoms and molecules interact with sunlight in the ionosphere they eject particles of light –photons – creating a natural phenomenon called airglow. Similar in concept to the short-duration auroras generated by powerful solar winds, airglow is energized by ordinary, day-to-day solar radiation. Airglow carries information on the upper atmosphere’s temperature, density, and composition. Depending upon altitude region, and excitation process, atmospheric gasses display a favoured airglow color.
Also known as zodiacal light, airglow is a constant halo of light across the entire sky originating from a thin atmospheric layer near 85 kilometers in altitude. One tenth as bright as the collective light from stars. The glow is so faint that light pollution and moonlight outshine it. Studying this natural phenomenon requires a very sensitive instrument.
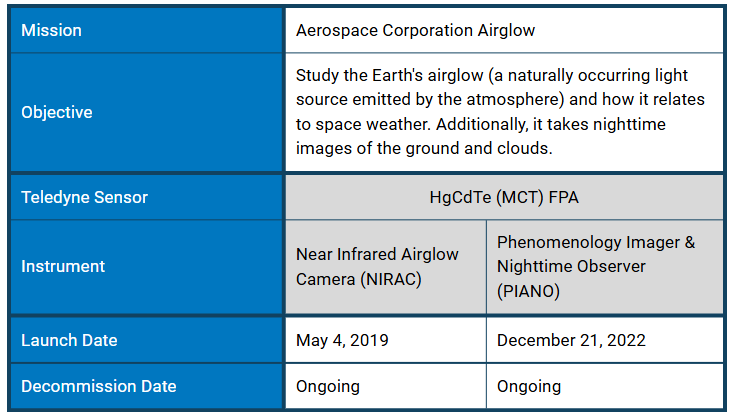
This technical challenge was solved by Aerospace’s Phenomenology Imager & Nighttime Observer (PIANO) with an HgCdTe (MCT) focal plane array developed by Teledyne Space Imaging. The sensor array flown on PIANO was the space premier of Teledyne’s 4K x 4K infrared detector, an upgrade from the 2K x 2K FPA on PIANO’s predecessor the Near Infrared Airglow Camera (NIRAC).
Images of the Earth’s surface are captured when no light is visible from the sun or moon, using airglow as a faint illumination source, producing detailed pictures of terrain features, city lights, clouds, roads, and lakes in wavelength bands not typically used for nighttime Earth imagery. Scientists use these images to observe weather systems at night and explore potential applications related to disaster monitoring for fires, floods, and winter storms.
Taking images under very low light conditions requires a long exposure time of 1.5 seconds. During that time, the ISS travels more than 10 kilometres which would substantially blur the image. Aerospace developed a patented orbital motion compensation system to correct the images enabling a spatial resolution of 80 meters. PIANO’s Earth surface imagery covers a 250 km-wide field of view every 10 seconds.
PIANO studies airglow directly, observing how its brightness varies over the course of the night and responds to changes in lower-atmospheric weather. It also tracks the transportation of aerosols as they blow through the ionosphere.
PIANO, which was integrated and flown by the Department of Defense’s Space Test Program, uses the airglow layer as a flashlight to look at the ground. Credit: NASA
About The Aerospace Corporation
The Aerospace Corporation is a national nonprofit corporation that operates a federally funded research and development center and has approximately 4,000 employees. With major locations in El Segundo, Calif.; Albuquerque, N.M.; Colorado Springs, Colo.; and the Washington, D.C., region, Aerospace addresses complex problems across the space enterprise and other areas of national significance through agility, innovation, and objective technical leadership. For more information, visit www.aerospace.org.
Works Cited
EMIT
eoPortal. (2025). ISS: EMIT (Earth surface Mineral dust source InvesTigation). https://www.eoportal.org/satellite-missions/iss-emit
National Aeronautics and Space Administration Jet Propulsion Laboratory. (n.d.). EMIT Surface Mineral Dust Source Investigation; Instrument-Overview. https://earth.jpl.nasa.gov/emit/instrument/overview/
NASA JPL: Photojournal. (2022, October 12). PIA25424: EMIT Instrument's First Light. https://photojournal.jpl.nasa.gov/catalog/PIA25424
ECOSTRESS
Beletic, J., & Jerram, P. (2019, July 12). Proceedings SPIE: Volume 11180, International Conference on Space Optics — ICSO 2018; 111803D. https://doi.org/10.1117/12.2536040
eoPortal. (2015, July 2). ISS: ECOSTRESS (ECOsystem Spaceborne Thermal Radiometer Experiment on Space Station). https://www.eoportal.org/satellite-missions/iss-ecostress
NASA JPL. (2025) Welcome to ECOSTRESS. https://ecostress.jpl.nasa.gov/
National Aeronautics and Space Administration Jet Propulsion Laboratory. (n.d.). EMIT Surface Mineral Dust Source Investigation; Instrument-Overview. https://earth.jpl.nasa.gov/emit/instrument/overview/
Ibid. (n.d.). NASA's ECOSTRESS Maps Burn Risk Across Phoenix Streets. https://ecostress.jpl.nasa.gov/news/nasas-ecostress-maps-burn-risk-across-phoenix-streets
University of Louisiana at Lafayette: Ray P. Authement College of Sciences. (2025). Research News. https://sciences.louisiana.edu/research/research-news
OCO-3
Ibid. Meet EMIT, the Newest Imaging Spectrometer. https://www.earthdata.nasa.gov/news/feature-articles/meet-emit-newest-imaging-spectrometer
Ibid. ECOSTRESS ECOsystem Spaceborne Thermal Radiometer Experiment on Space Station. https://www.jpl.nasa.gov/missions/ecosystem-spaceborne-thermal-radiometer-experiment-on-space-station-ecostress/
Ibid. (2024, April 14). What’s New with OCO-3. https://ocov3.jpl.nasa.gov/whats-new-oco-3/
Ibid., (2021, June 7). NASA Map Gives Most Accurate Space-Based View of LA’s Carbon Dioxide. https://www.jpl.nasa.gov/news/nasa-map-gives-most-accurate-space-based-view-of-las-carbon-dioxide/
NASA Facts. (n.d.). Orbiting Carbon Observatory-3 Fact sheet. https://d2pn8kiwq2w21t.cloudfront.net/documents/oco-3-fact-sheet-4-pages.pdf
Yue Liu, Y., Peñuelas, J., Cescatti, A., Zhang, Y., & Zhang, Z. (2024, December 12). Atmospheric Dryness Dominates Afternoon Depression of Global Terrestrial Photosynthesis. https://agupubs.onlinelibrary.wiley.com/doi/10.1029/2024GL110954
Airglow
Bayless, A., Rudy, R., Gelinas L., Hecht, J., Gutierrez, D., & Crawford, K. (2021, September 2) Pre-Flight Calibrations for the PIANO Airglow Camera on the ISS. https://digitalcommons.usu.edu/calcon/CALCON2021/all2021content/27/
eoPortal. (2022, February 14). STP-H7 (Space Test Program -Houston7). https://www.eoportal.org/satellite-missions/iss-stp-h8#stp-h7-space-test-program– houston7
Friends of NASA. (2025, January 14). Zodiacal Light, Starlinks, Milky Way Stars & Airglow | International Space Station. https://www.friendsofnasa.org/2025/01/zodiacal-light-starlinks-milky-way.html
NASA. (2018, October 22). Why NASA Watches Airglow, the Colors of the (Upper Atmospheric) Wind. https://www.nasa.gov/solar-system/why-nasa-watches-airglow-the-colors-of-the-upper-atmospheric-wind/
Space News. (2019, December 9). NIRAC: Aerospace’s Novel Camera Gives Scientists “Night Vision” from the ISS. https://spacenews.com/nirac-aerospaceaeurs-novel-camera-gives-scientists-aeuroenight-visionaeur-from-the-iss/
The Aerospace Corporation. (2022, March 1). New ISS Camera to Provide Unprecedented Nighttime Imagery. https://aerospace.org/article/new-iss-camera-provide-unprecedented-nighttime-imagery?fbclid=IwY2xjawJwmBZleHRuA2FlbQIxMQABHpJLXpduwjpQGcjo6qoki3yeWwWkHpcv7zD_tzqvnkFi3_gi_16csFFmeuod_aem_i3rnPlIsCtv4j2RUt3CuTg

