As the effects of climate change tangibly increase, so does the need to understand the Earth’s intertwined networks of life, air, water, and land. Satellites can effectively gather environmental data from every part of the globe including remote areas too impractical for ground-based instruments like polar ice caps, mountains, rainforests, wetlands, islands, and deserts.
One of NASA’s fundamental goals is to learn more about the Earth. In 1991, they established the Earth Science Enterprise (ESE) international research programme to study our planet's whole environment as an integrated system that encompasses a complex series of interactions between the surface and atmosphere. Both human activity – like burning fossil fuels – and natural processes – like decay and volcanic eruptions – directly impact the ecosystem affecting everything from forest and ocean health to air and water quality.
NASA uses an integrated network of scientific instruments on spacecraft – including the ISS – planes, ships, buoys, and ground stations to map clouds, vegetation cover, atmospheric composition, sea temperature, and other natural processes. Adding to decades of research, this comprehensive data collection informs climate models to assess and predict the effects of climate change. Working alongside international partners, including ESA, CNES, and JAXA, this scientific endeavour benefits everyone living on Earth.
This video shows observations made by the A-Train during Tropical Storm Debby in August of 2006 and demonstrates satellite orbits over a 12-hour period. The tight formation facilitates data collection, enabling dozens of scientific instruments on several satellites to take measurements at the same time. Credit: NASA/Goddard Space Flight Center Scientific Visualization Studio
The backbone of ESE is the Afternoon Train: a network of satellites flying in a close formation on a Sun-synchronous polar orbit. Nicknamed the A-Train – after Billy Strayhorn‘s jazz standard “Take the A-Train” – each satellite crosses the equator within a few minutes – or seconds – of each other around 1:30 p.m. local time. Flying in a close orbit synergises the observations captured by all the instruments on each spacecraft because the observation conditions – affected by cloud cover – are consistent because all the spacecraft are simultaneously in the area. This optimisation exceeds the capabilities of any single satellite and maximises the substantial resources required to design, launch, and maintain spacecraft.
Now running for over two decades, sensors produced by Teledyne Space Imaging have been on four of the seven satellites in the A-Train:

 The A-Train constellation with orbiting times as it appeared in 2003. Flying just 12.5 seconds behind CloudSat, CALIPSO uses a Sodern SED16 star tracker equipped with a CCD47-20 from Teledyne Space Imaging. Note this image includes two satellites that failed at launch: Glory (equipped with a Teledyne Space Imaging SWIR sensor) and OCO-1 (equipped with three Teledyne Space Imaging FPAs). A duplicate OCO-2 satellite joined the A-Train in 2014. Credit: NASA
Star Tracker
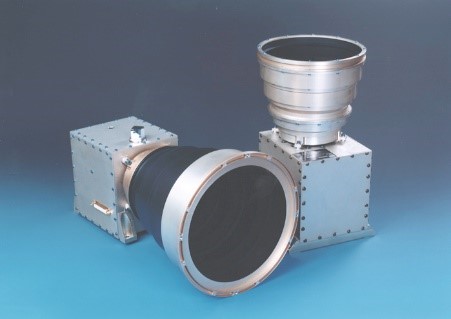
Teledyne Space Imaging produced the CCD47-20 sensor integrated with the Sodern SED26 star tracker on the OCO-2 mission. Credit Sodern ArianeGroup
As a satellite zips through the atmosphere, it’s useful to know where it is. Without an accurate way of tracking the orientation and attitude of a satellite, maintaining close formations like the A-Train would be impossible. Ensuring consistent positioning is necessary for data continuity, as well as preventing a disastrous collision from creating a debris field and endangering the work of many other spacecraft.
Essential to successful satellite navigation, star trackers are a key component of the Attitude Determination and Control System (ADCS), which is responsible for steering the satellite and maintaining its orbit.
Star trackers determine location by taking a picture of the stars in view, then using a series of algorithms to identify star constellations, calculate their position, and compare them to internal star charts. This data is then transmitted to the satellite’s control system, which uses a series of gyroscopes to ensure that the spacecraft – and sensitive instruments – are pointed in the right direction. A GPS receiver cross-checks satellite position information for accurate orbit ephemeris determination and onboard time delivery.
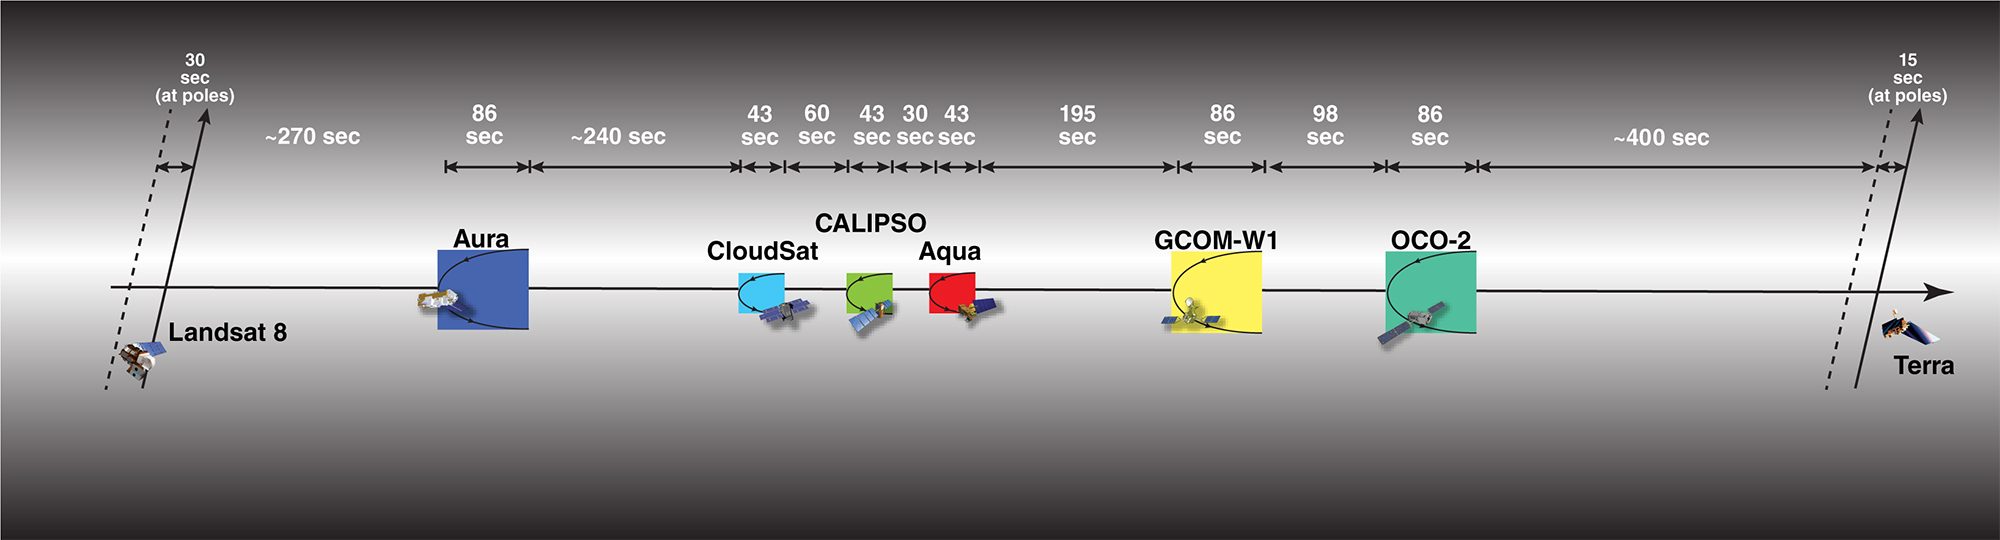
The A-Train constellation with control box times as it appeared in 2017. Constellation flying requires ongoing coordinated manoeuvring. Each satellite is assigned a control box: a designated area where the satellite is allowed to drift. Encroaching the control box boundary triggers the satellite to perform corrective manoeuvres. Note that the Landsat 8 and Terra satellites cross the A-Train orbit path. Credit: NASA
This animation shows RGB color images from NASA’s Aqua satellite for December 31, 2019 through January 5, 2020. A plume of brown smoke extends 4,000 miles (6,400 km) from the southeastern coast of Australia across the Pacific Ocean. The overlaid vertical cross sections show CALIPSO lidar observations for these same days. The bright colors indicate the presence of small particles (aerosols) and the white color indicates clouds. The dark shading below these layers is due to the absence of lidar signals below the opaque smoke layers. Credit: NASA Langley/Roman Kowch
Aerosols scatter and absorb incoming sunlight, radiating heat or cooling it down. They also play a significant role in cloud formation and precipitation. Unlike greenhouse gases, the distribution of aerosols are highly variable as they come from a variety of sources and tend to move rapidly through the troposphere. Additionally, clouds can overlap each other making it difficult to determine vertical distribution.
A joint effort between NASA and CNES, the CALIPSO (Cloud-AerosolLidar and Infrared Pathfinder Satellite Observations) probe combined an active lidar instrument with passive infrared and visible imagers to observe the vertical distribution of clouds and aerosols during the day and night.
Launched on the same rocket in 2006, the CloudSat mission featured a cloud profiling radar system that paired well with the data collected by CALIPSO. For almost 18 years, they provided novel 3-D perspectives of how clouds and aerosols form, evolve, and affect weather, climate, and air quality.
CALIPSO collected over 4.6 billion profile measurements and produced more than 92 terabytes of data that has been used in over 1,000 studies. All the information from the A-Train constellation is available to scientists and policymakers through the Earth Observing System Data and Information System (EOSDIS). The ESE program is part of the U.S. interagency effort, the Global Change Research Program.
This article is the first of a four-part series covering Teledyne Space Imaging's contributions to the A-Train:
- Aura
- OCO-2 (Orbiting Carbon Observatory)
- PARASOL Polarization & Anisotropy of Reflectances for Atmospheric Sciences coupled with Observations from a Lidar)

